

Answered step by step
Verified Expert Solution
Question
1 Approved Answer
is urgent. please answer all questions Question Four (B) The following table shows the NYSE composite index over a recent 15-year period: End of Year
is urgent. please answer all questions
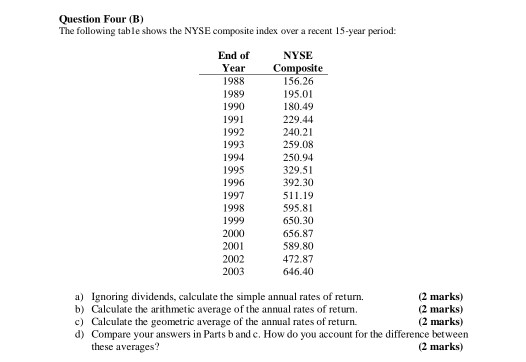
Question Four (B) The following table shows the NYSE composite index over a recent 15-year period: End of Year 1988 1989 1990 1991 1992 1993 1994 1995 1996 1997 1998 1999 2000 2001 2002 2003 NYSE Composite 156.26 195.01 180.49 229.44 240.21 259.08 250.94 329.51 392.30 511.19 595.81 650.30 656.87 589.80 472.87 646.40 a) Ignoring dividends, calculate the simple annual rates of return. (2 marks) b) Calculate the arithmetic average of the annual rates of retum. (2 marks) c) Calculate the geometric average of the annual rates of return. (2 marks) d) Compare your answers in Parts and c. How do you account for the difference between these averages? (2 marks)Step by Step Solution
There are 3 Steps involved in it
Step: 1

Get Instant Access to Expert-Tailored Solutions
See step-by-step solutions with expert insights and AI powered tools for academic success
Step: 2

Step: 3
Ace Your Homework with AI
Get the answers you need in no time with our AI-driven, step-by-step assistance
Get Started
Understanding Terrorist Finance
Authors: T. Wittig
2011th Edition
0230291848, 978-0230291843