Question
Is Your Car Made in the U.S.A.? The phrase made in the U.S.A. has become a familiar battle cry as U.S. workers try to protect
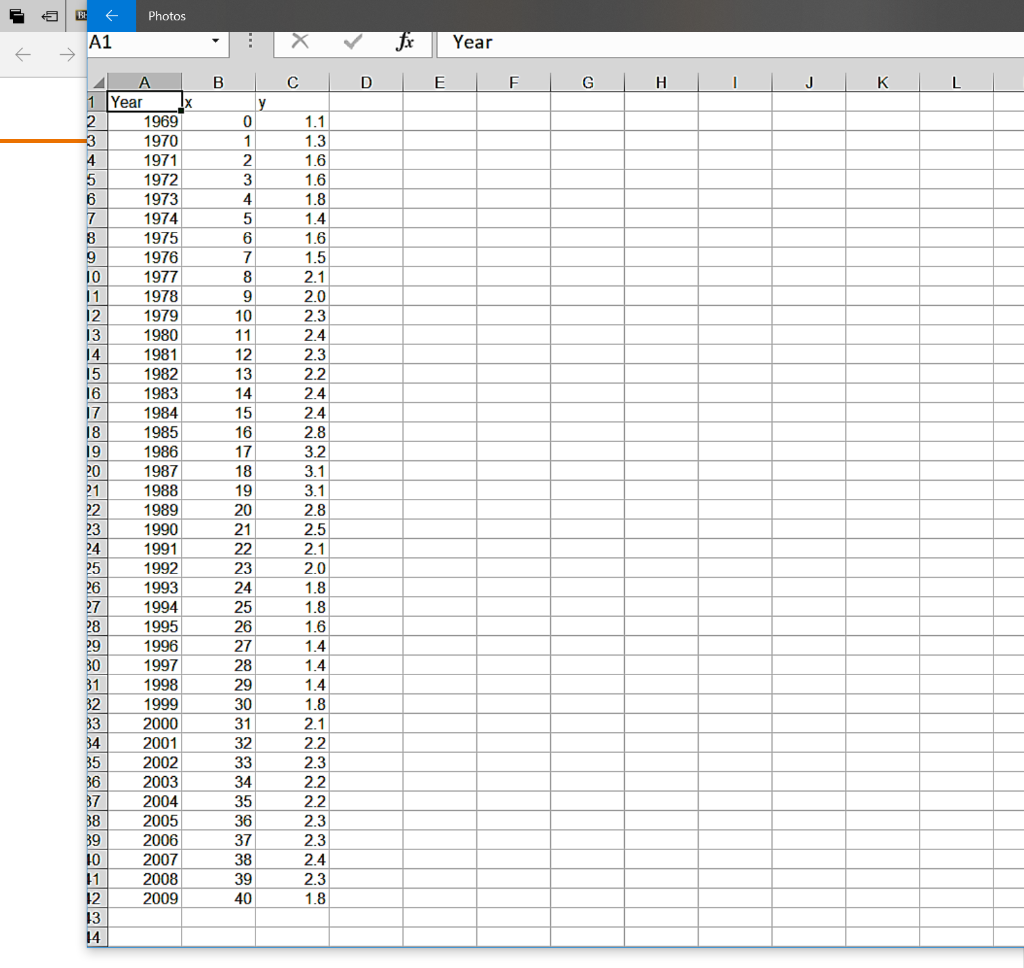
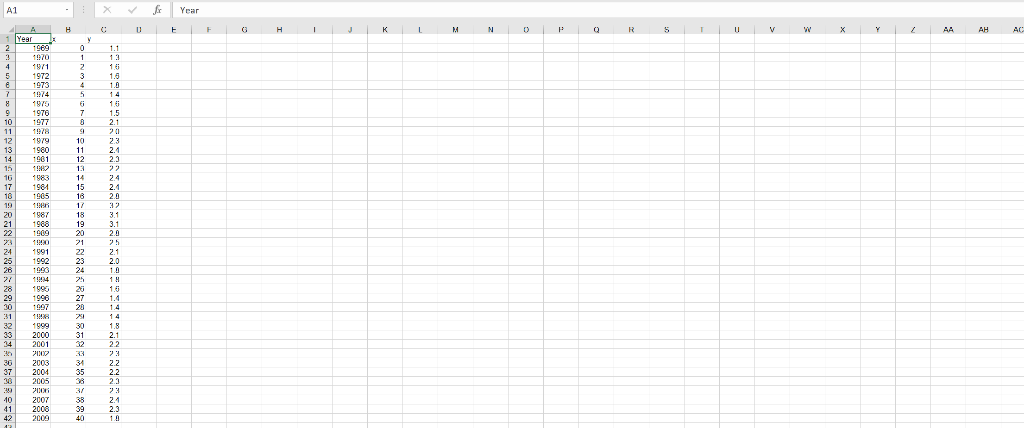
 Is Your Car Made in the U.S.A.? The phrase made in the U.S.A. has become a familiar battle cry as U.S. workers try to protect their jobs from overseas competition. For the past few decades, a major trade imbalance in the United States has been caused by a flood of imported goods that enter the country and are sold at lower cost than comparable American-made goods. One prime concern is the automotive industry, in which the number of imported cars steadily increased during the 1970s and 1980s. The U.S. automobile industry has been besieged with complaints about product quality, worker layoffs, and high prices, and has spent billions in advertising and research to produce an American-made car that will satisfy consumer demands. Have they been successful in stopping the flood of imported cars purchased by American consumers? The data in the table represent the numbers of imported cars y sold in the United States (in millions) for the years 19692009. To simplify the analysis, we have coded the year using the coded variable x = Year 1969.
1. Using a scatterplot, plot the data for the years 19691988. Does there appear to be a linear relationship between the number of imported cars and the year? 2. Use a computer software package to find the least-squares line for predicting the number of imported cars as a function of year for the years 19691988. 3. Is there a significant linear relationship between the number of imported cars and the year? 4. Use the computer program to predict the number of cars that will be imported using 95% prediction intervals for each of the years 2007, 2008, and 2009. 5. Now look at the actual data points for the years 20072009. Do the predictions obtained in step 4 provide accurate estimates of the actual values observed in these years? Explain. 6. Add the data for 19892009 to your database, and recalculate the regression line. What effect have the new data points had on the slope? What is the effect on SSE? 7. Given the form of the scatterplot for the years 19692009, does it appear that a straight line provides an accurate model for the data? What other type of model might be more appropriate? (Use residual plots to help answer this question.) 
Step by Step Solution
There are 3 Steps involved in it
Step: 1

Get Instant Access to Expert-Tailored Solutions
See step-by-step solutions with expert insights and AI powered tools for academic success
Step: 2

Step: 3

Ace Your Homework with AI
Get the answers you need in no time with our AI-driven, step-by-step assistance
Get Started


