

Answered step by step
Verified Expert Solution
Question
1 Approved Answer
IT ALL HAS TO BE IN ONE CODE : The goal for this assignment is to develop a command - line technical analysis toolkit for
IT ALL HAS TO BE IN ONE CODE :
The goal for this assignment is to develop a commandline technical analysis toolkit for the
exchange platform.
TASK : Compute candlestick data
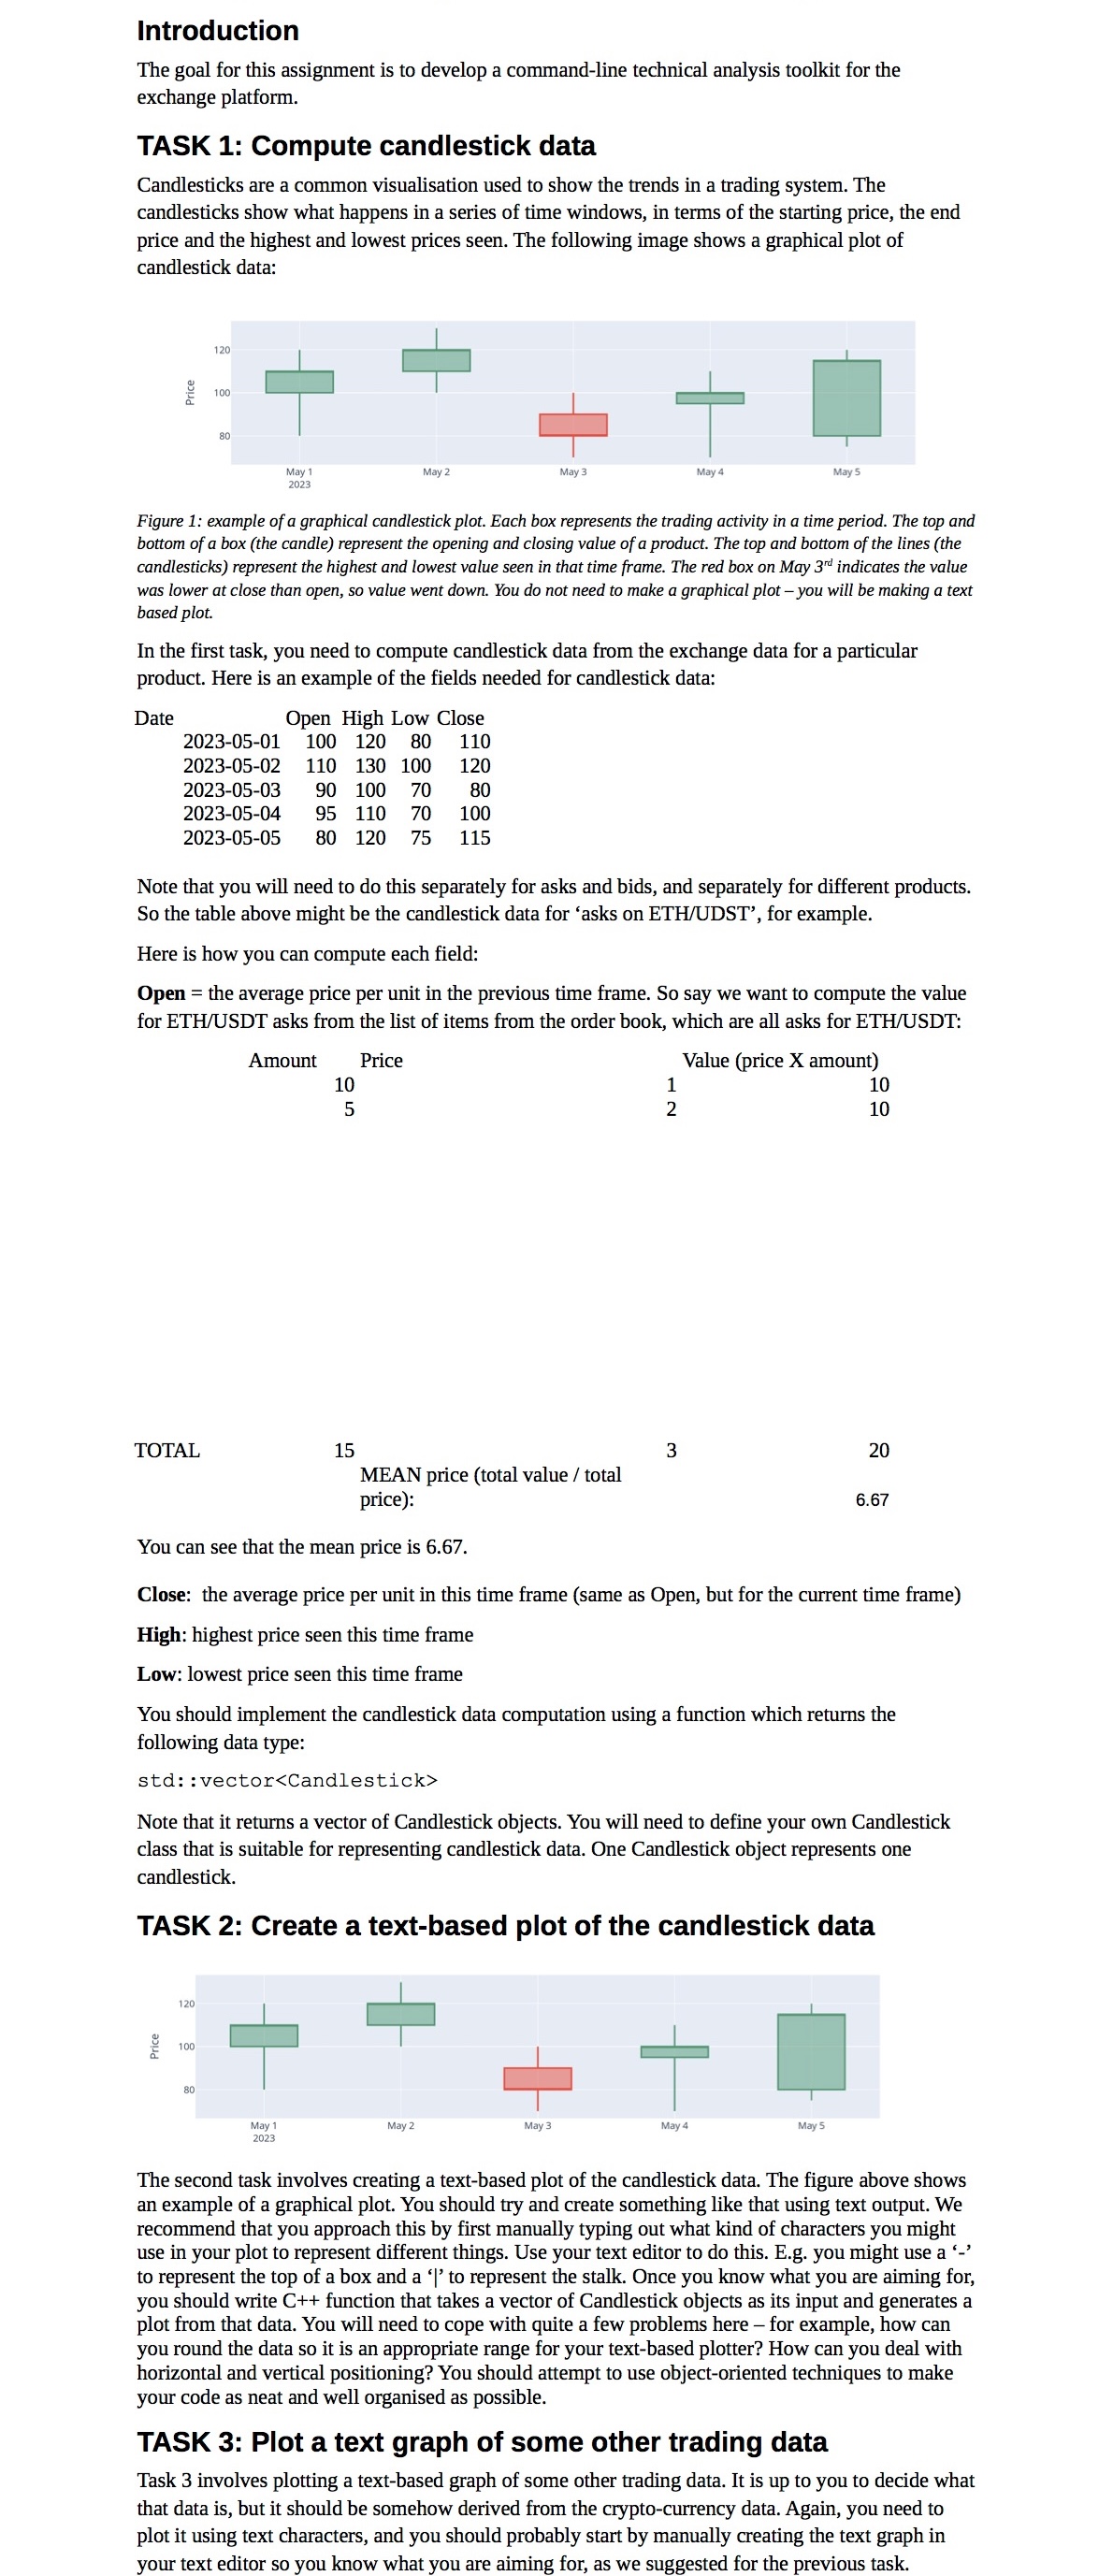
Candlesticks are a common visualisation used to show the trends in a trading system. The
candlesticks show what happens in a series of time windows, in terms of the starting price, the end
price and the highest and lowest prices seen. The following image shows a graphical plot of
candlestick data:
Figure : example of a graphical candlestick plot. Each box represents the trading activity in a time period. The top and
bottom of a box the candle represent the opening and closing value of a product. The top and bottom of the lines the
candlesticks represent the highest and lowest value seen in that time frame. The red box on May indicates the value
was lower at close than open, so value went down. You do not need to make a graphical plot you will be making a text
based plot.
In the first task, you need to compute candlestick data from the exchange data for a particular
product. Here is an example of the fields needed for candlestick data:
Date
Note that you will need to do this separately for asks and bids, and separately for different products.
So the table above might be the candlestick data for 'asks on ETHUDST for example.
Here is how you can compute each field:
Open the average price per unit in the previous time frame. So say we want to compute the value
for ETHUSDT asks from the list of items from the order book, which are all asks for ETHUSDT:
Value price amount
TOTAL
MEAN price total value total
price:
You can see that the mean price is
Close: the average price per unit in this time frame same as Open, but for the current time frame
High: highest price seen this time frame
Low: lowest price seen this time frame
You should implement the candlestick data computation using a function which returns the
following data type:
std: :vectorC
Step by Step Solution
There are 3 Steps involved in it
Step: 1

Get Instant Access to Expert-Tailored Solutions
See step-by-step solutions with expert insights and AI powered tools for academic success
Step: 2

Step: 3
Ace Your Homework with AI
Get the answers you need in no time with our AI-driven, step-by-step assistance
Get Started
Database Design And Relational Theory Normal Forms And All That Jazz
Authors: Chris Date
1st Edition
1449328016, 978-1449328016