It is a tutorial question
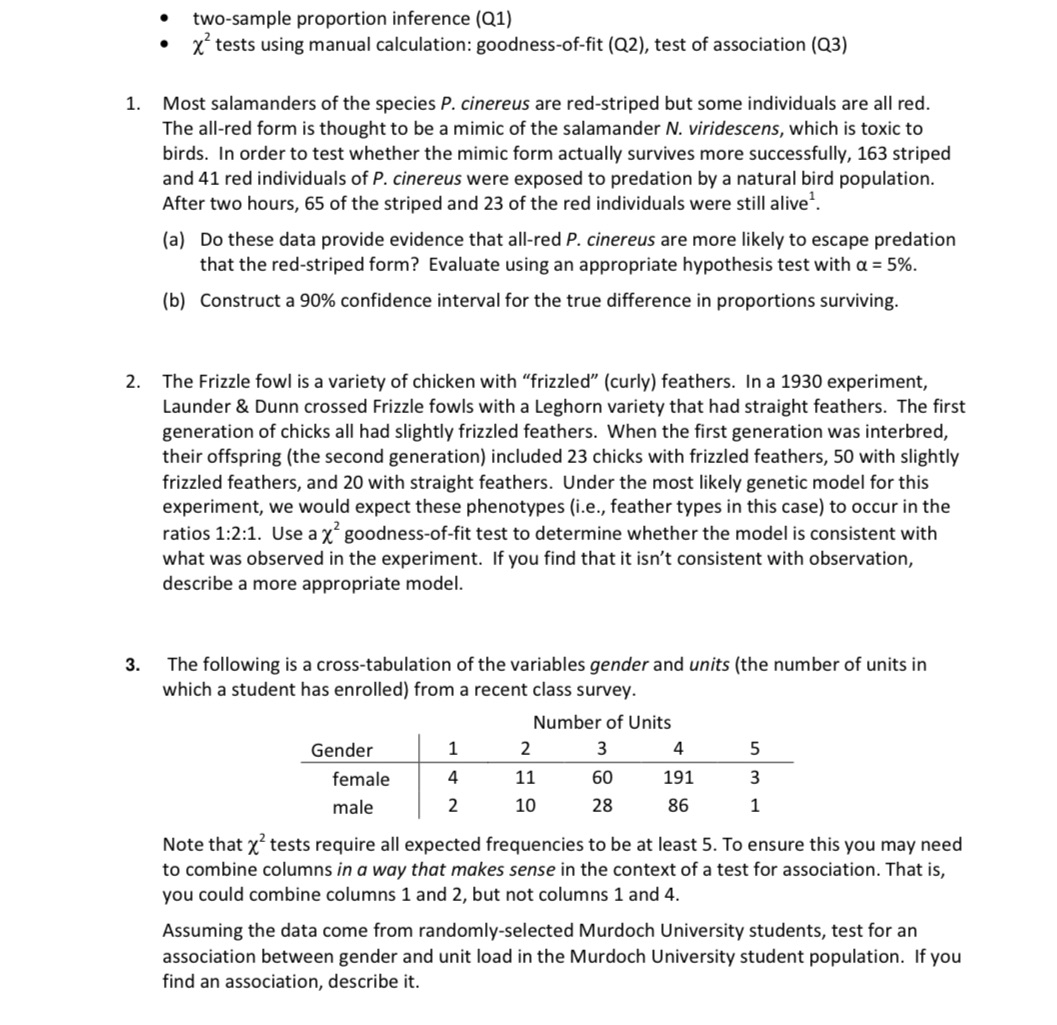
1. 0 two-sample proportion inference ((11) 0 :6 tests using manual calculation: goodness-of-fit (Q2), test of association (Q3) Most salamanders of the Species P. cinereus are red-striped but some individuals are all red. The all-red form is thought to be a mimic of the salamander N. viridescens, which is toxic to birds. In order to test whether the mimic form actually survives more successfully, 163 striped and 41 red individuals of P. cinereus were exposed to predation by a natural bird population. After two hours, 65 of the striped and 23 of the red individuals were still alive'. (a] Do these data provide evidence that all-red P. cinereus are more likely to escape predation that the red-striped form? Evaluate using an appropriate hypothesis test with o = 5%. (b) Construct a 90% confidence interval for the true difference in proportions surviving. The Frizzle fowl is a variety of chicken with \"frizzled\" (curly) feathers. In a 1930 experiment, Launder 8t. Dunn crossed Frizzle fowls with a Leghorn variety that had straight feathers. The rst generation of chicks all had slightly frizzled feathers. When the rst generation was interbred, their offspring (the second generation) included 23 chicks with frizzled feathers, 50 with slightly frizzlecl feathers, and 20 with straight feathers. Under the most likely genetic model for this experiment, we would expect these phenotypes (i.e., feather types in this case) to occur in the ratios 1:2:1. Use a :1 goodness-of-fit test to determine whether the model is consistent with what was observed in the experiment. if you find that it isn't consistent with observation, describe a more appropriate model. The following is a cross-tabulation of the variables gender and units (the number of units in which a student has enrolled) from a recent class survey. Number of Units Note that x2 tests require all expected frequencies to be at least 5. To ensure this you may need to combine columns in a way that makes sense in the context of a test for association. That is, you could combine columns 1 and 2, but not columns 1 and 4. Assuming the data come from randomly-selected Murdoch University students, test for an association between gender and unit load in the Murdoch University student population. ifyou find an association, describe it


