Answered step by step
Verified Expert Solution
Question
1 Approved Answer
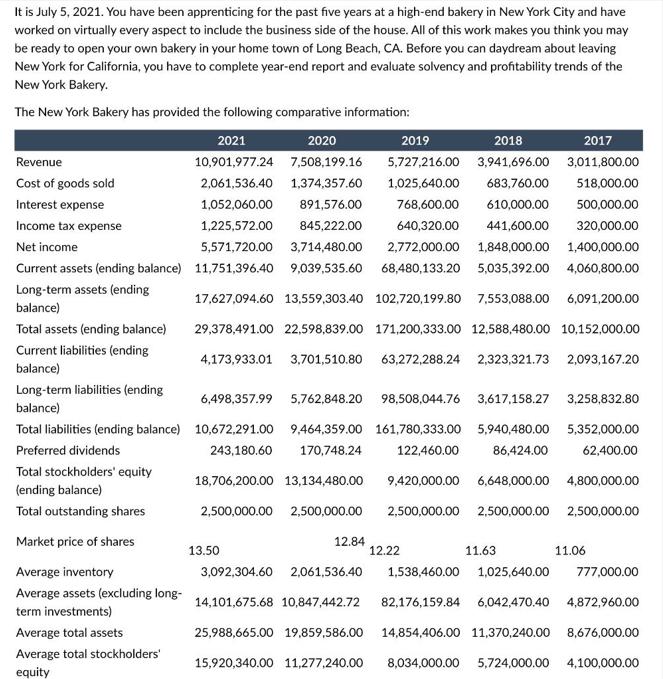
It is July 5, 2021. You have been apprenticing for the past five years at a high-end bakery in New York City and have


It is July 5, 2021. You have been apprenticing for the past five years at a high-end bakery in New York City and have worked on virtually every aspect to include the business side of the house. All of this work makes you think you may be ready to open your own bakery in your home town of Long Beach, CA. Before you can daydream about leaving New York for California, you have to complete year-end report and evaluate solvency and profitability trends of the New York Bakery. The New York Bakery has provided the following comparative information: Revenue Cost of goods sold Interest expense Income tax expense Net income Current assets (ending balance) Long-term assets (ending balance) Total stockholders' equity (ending balance) Total outstanding shares Market price of shares Average inventory Average assets (excluding long- term investments) Average total assets 2021 2020 2018 3,941,696.00 10,901,977.24 7,508,199.16 2,061,536.40 1,374,357.60 683,760.00 1,052,060.00 891,576.00 610,000.00 441,600.00 2,772,000.00 1,848,000.00 1,400,000.00 1,225,572.00 845,222.00 5,571,720.00 3,714,480.00 11,751,396.40 9,039,535.60 68,480,133.20 5,035,392.00 4,060,800.00 17,627,094.60 13,559,303.40 102,720,199.80 7,553,088.00 6,091,200.00 29,378,491.00 22,598,839.00 171,200,333.00 12.588,480.00 10,152,000.00 Average total stockholders' equity Total assets (ending balance) Current liabilities (ending balance) Long-term liabilities (ending balance) 6,498,357.99 5,762,848.20 98,508,044.76 3,617,158.27 3,258,832.80 Total liabilities (ending balance) 10,672,291.00 9,464,359.00 161,780,333.00 5,940,480.00 5,352,000.00 Preferred dividends 243,180.60 170,748.24 122,460.00 86,424.00 62,400.00 18,706,200.00 13,134,480.00 9,420,000.00 6,648,000.00 4,800,000.00 2,500,000.00 2,500,000.00 2,500,000.00 2,500,000.00 2,500,000.00 4,173,933.01 3,701,510.80 13.50 2019 5,727,216.00 1,025,640.00 768,600.00 640,320.00 12.84 25,988,665.00 19,859,586.00 2017 3,011,800.00 518,000.00 500,000.00 320,000.00 63,272,288.24 2,323,321.73 2,093,167.20 12.22 11.63 11.06 3,092,304.60 2,061,536.40 1,538,460.00 1,025,640.00 777,000.00 14,101,675.68 10,847,442.72 82,176,159.84 6,042,470.40 4,872,960.00 14,854,406.00 11,370,240.00 8,676,000.00 15,920,340.00 11,277,240.00 8,034,000.00 5,724,000.00 4,100,000.00 You identified an error in Net Income and Average Total Stockholders' Equity. Net Income was overstated by 448.615.77 and Average Total Stockholders' Equity was understated by 28,714.22 in 2021. Calculate Return on Stockholders' Equity for 2021 using the corrected amounts
Step by Step Solution
★★★★★
3.44 Rating (154 Votes )
There are 3 Steps involved in it
Step: 1
The corrected Net Income for 2021 is 5571720 44861577 11...
Get Instant Access to Expert-Tailored Solutions
See step-by-step solutions with expert insights and AI powered tools for academic success
Step: 2

Step: 3

Ace Your Homework with AI
Get the answers you need in no time with our AI-driven, step-by-step assistance
Get Started


