Answered step by step
Verified Expert Solution
Question
1 Approved Answer
It says to provide a complete interpretation of the results, I'm confused T-Test Group Statistics Std. Error RESPONDENTS SEX N Mean Std. Deviation Mean RESPONDENT
It says to provide a complete interpretation of the results, I'm confused
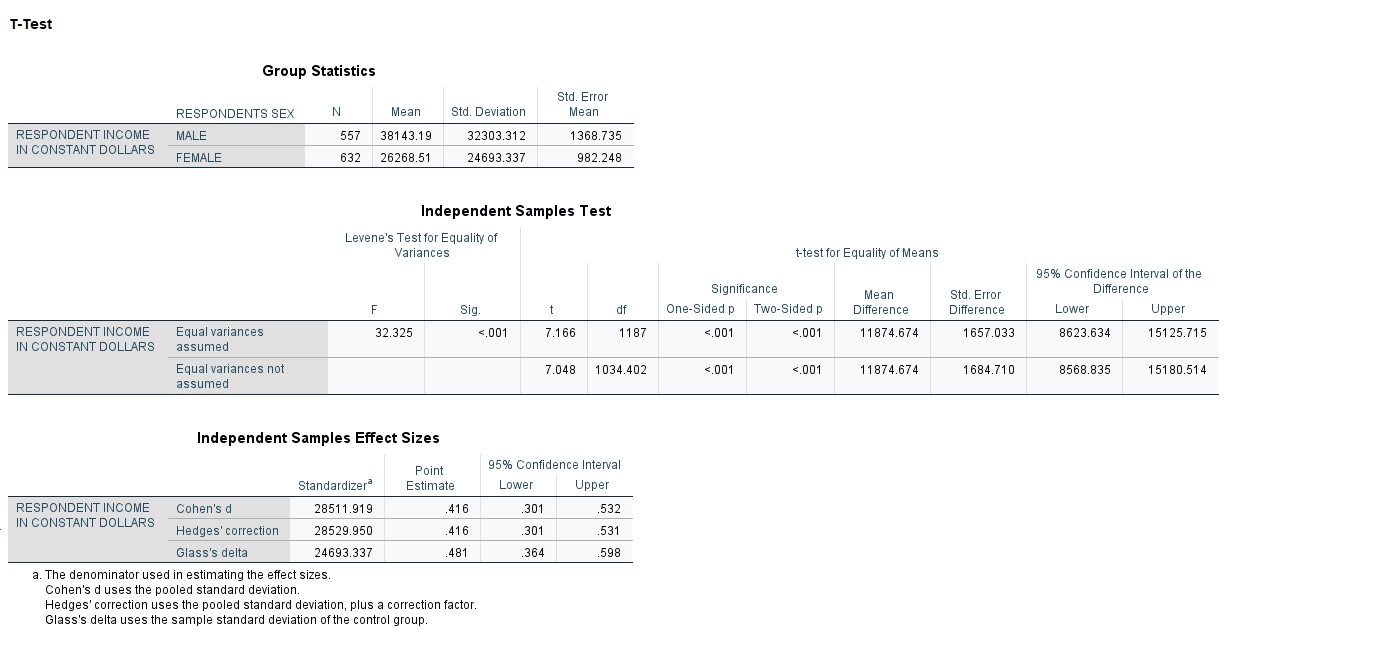
T-Test Group Statistics Std. Error RESPONDENTS SEX N Mean Std. Deviation Mean RESPONDENT INCOME MALE 557 38143.19 32303.312 1368.735 IN CONSTANT DOLLARS FEMALE 632 26268.51 24693.337 982.248 Independent Samples Test Levene's Test for Equality of Variances t-test for Equality of Means 95% Confidence Interval of the Significance Mean Std. Error Difference F Sig. df One-Sided p Two-Sided p Difference Difference Lower Upper RESPONDENT INCOME Equal variances 32.325 <.001 in constant dollars assumed equal variances not independent samples effect sizes point confidence interval standardizera estimate lower upper respondent income cohen d .301 hedges correction glass delta .481 a. the denominator used estimating uses pooled standard deviation. deviation plus a factor. sample of control group>Step by Step Solution
There are 3 Steps involved in it
Step: 1
Get Instant Access to Expert-Tailored Solutions
See step-by-step solutions with expert insights and AI powered tools for academic success
Step: 2
Step: 3
Ace Your Homework with AI
Get the answers you need in no time with our AI-driven, step-by-step assistance
Get Started