

Answered step by step
Verified Expert Solution
Question
1 Approved Answer
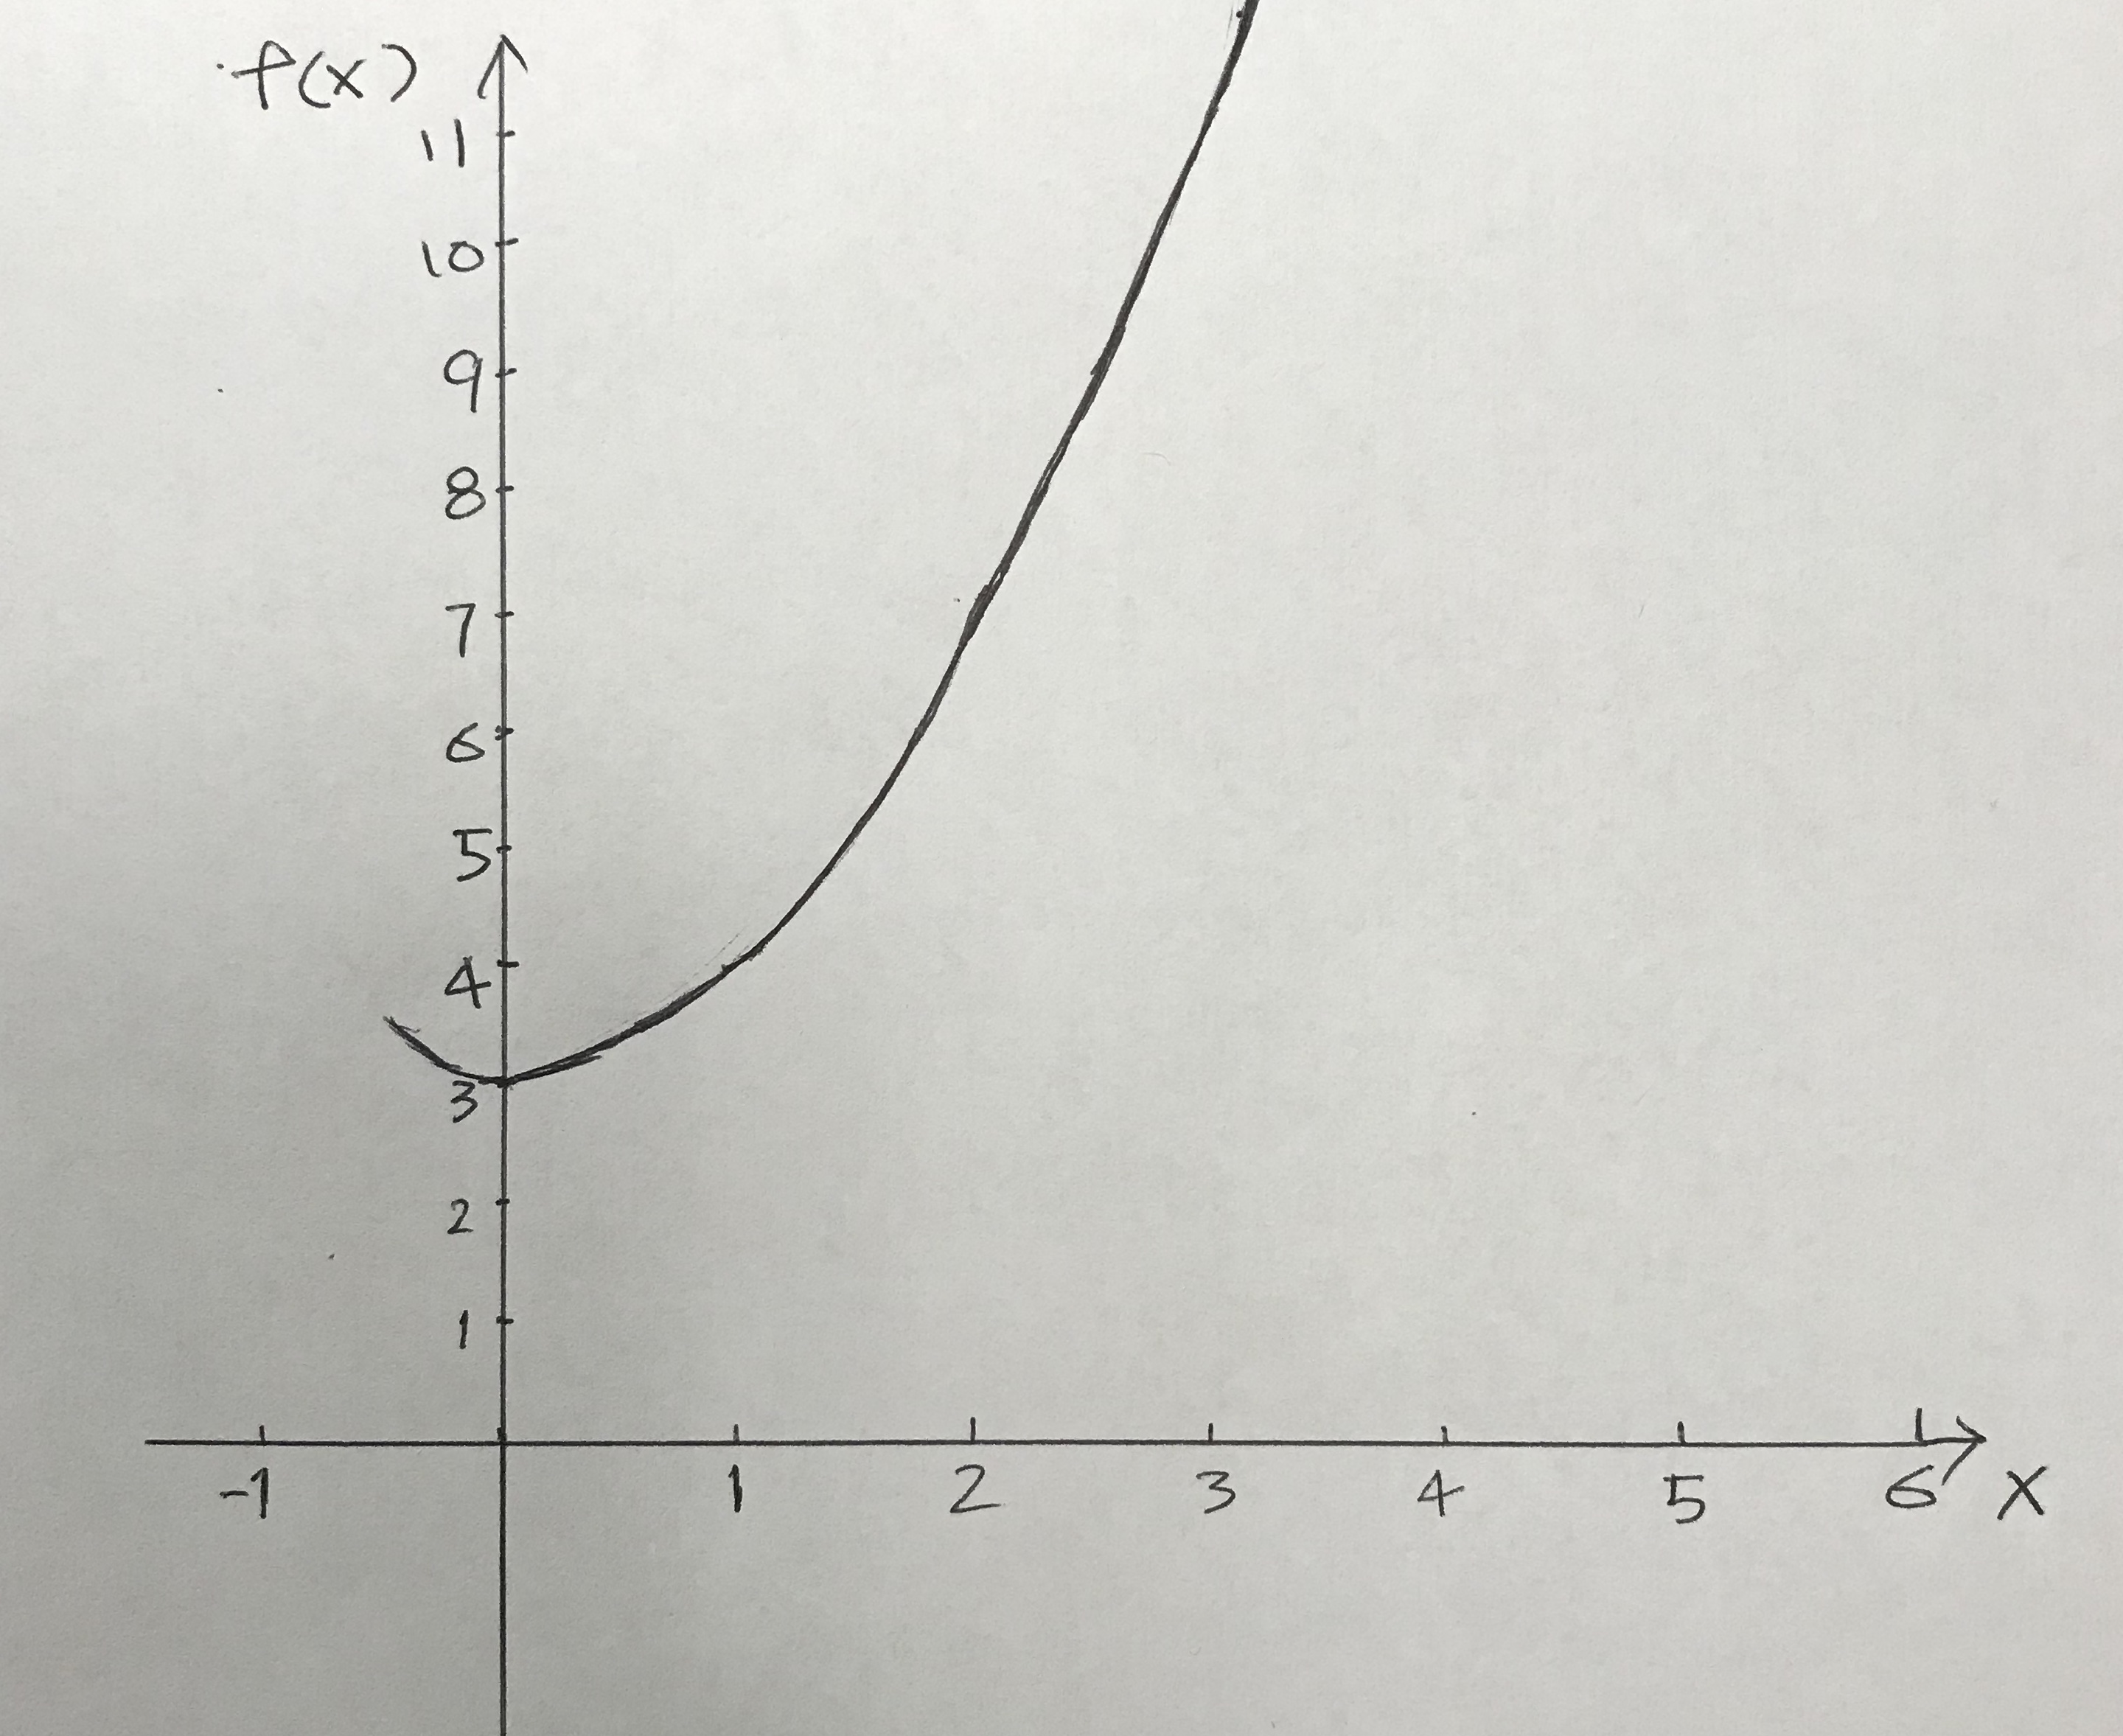
It would be great if you can show each step. Thank you very much for your time. The following graph shows the function f(x) =
It would be great if you can show each step.
Thank you very much for your time.
The following graph shows the function f(x) = x2 + 3 on the interval [0, 2].
Step by Step Solution
There are 3 Steps involved in it
Step: 1

Get Instant Access to Expert-Tailored Solutions
See step-by-step solutions with expert insights and AI powered tools for academic success
Step: 2

Step: 3
Ace Your Homework with AI
Get the answers you need in no time with our AI-driven, step-by-step assistance
Get Started
Financial Algebra advanced algebra with financial applications
Authors: Robert K. Gerver
1st edition
978-1285444857, 128544485X, 978-0357229101, 035722910X, 978-0538449670