

Question
Its 2006. You work for an investment bank, and need to advise a company that is considering acquiring Winnebago. You have been given the Balance
Its 2006. You work for an investment bank, and need to advise a company that is considering acquiring Winnebago. You have been given the Balance Sheet and Income Statement for Winnebago as of August 25, 2006. Winnebago has historically repurchased large amounts of stock with their excess cash flow. These stock repurchases have the same impact as dividends (e.g., in the MM world) so we will assume that Winnebago will pay out all available cash flows above some minimum level required for Net Working Capital in dividends in the future. As we have shown earlier in the semester if Winnebago reinvests these cash flows in projects that earn the return the market requires for Winnebago, the value of the stock will not change, so this assumption is appropriate.
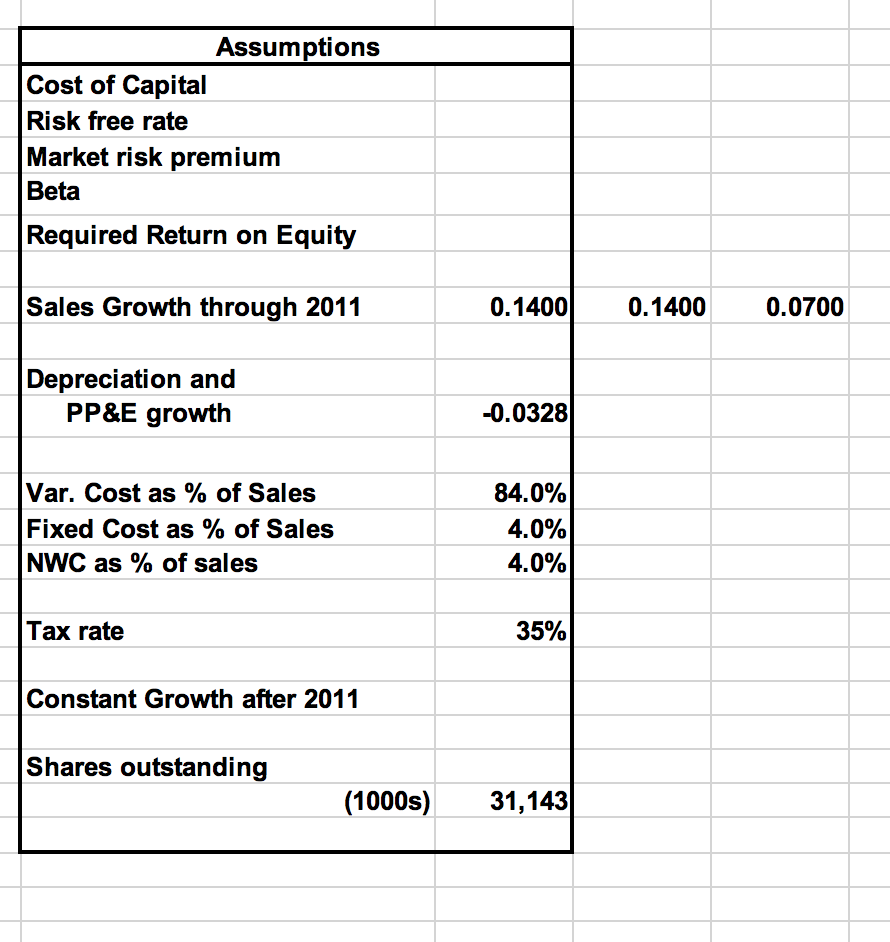
Depreciation expense and investment in fixed assets (Property Plant and Equipment, PP&E) will grow at the same rate as Sales.
Because we assume they pay out all excess cash, Financial Income will be zero in the future.
Tax Rate 35.0%
Use the screenshot to answer the highlighted questions 1 - 4: (Please provide an explanation for your work)

1. Use the assumptions in #1, calculate the accounting break-even level of sales for 2008.
2. Assume the company will need to hold Net Working Capital (including cash) equal to 4% of the
next years sales going forward. You will also need to project 2012 Sales to calculate the NWC in 2011.
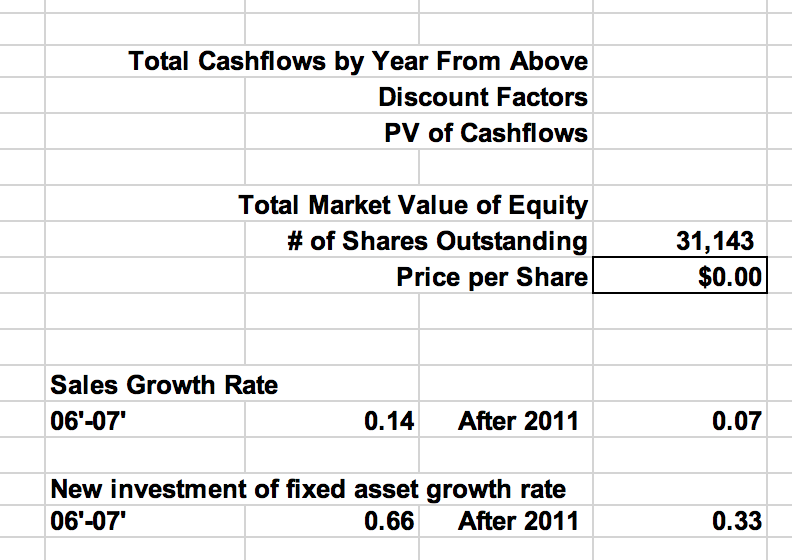
3. Winnebago has no long-term debt (see the 2006 report). Calculate the price of Winnebago stock
from the cashflows you calculated above. Assume the Market Return is expected to be 13.5%
and the Risk Free rate is 2.5%. Assume there are 31,143,000 shares outstanding.
4. Suppose Winnebago decides to become levered. How would you expect this decision to affect
the total value of the firm? Please be specific about the assumptions you make when answering this question.
Actual 2004 Actual 2005 Actual 2006 Projected 2007 Projected 2008 Projected 2009 Projected 2010 Projected 2011 Projected 2012 991,974 844,998 985,419 827,752 1,664,334 1,398,041 1,780,838 1,495,904 Sales Variable Costs Gross Profit Fixed Costs Depreciation expense Financial Income Pre Tax Income Income Taxes 1,114,154 942,357 171,797 51,371 9,628 1,436 112,234 41,593 864,403 748,867 115,536 41,803 10,635 5,097 68,195 23,451 157,667 38,431 12,124 1,123,378 943,638 179,741 44,935 11,727 1,280,651 1,075,747 204,904 51,226 11,343 1,459,942 1,226,351 233,591 58,398 10,971 266,293 66,573 10,612 146,976 38,723 9,999 2,635 100,889 35,817 65,072 284,934 71,234 11,355 107,112 37,489 123,079 43,078 142,335 49,817 164,222 57,478 106,744 189, 108 66,188 202,346 70,821 Net Income 70,641 44,744 69,623 80,001 92,518 122,920 131,525 + Depreciation Operating Cash Flow 9,628 $80,269 9,999 $75,071 10,635 $55,379 12,124 $81,747 11,727 $91,728 11,343 $103,861 10.971 $117,715 10,612 $133,532 11,355 $142,879 - $ Net Investment in Net Working Capital New Investment in Fixed Assets $ $716 $ (10,588) $ (33,294) $ (9,653) $ 10,431 $ (4,830) $ - $ (8,000) $ (13,251) $ (21,947) $ (36,351) $ (60,209) $ (79,967) Total Cashflow $70,397 $32,124 $60,980 $73, 747 $78,477 $81,914 $81,364 $73,323 $62,912 Net Working Capital $164,175 $197,469 $187,038 $44,935 $51,226 $58,398 $66,573 $71,234 $ . Assumptions Cost of Capital Risk free rate Market risk premium Beta Required Return on Equity Sales Growth through 2011 0.14000.1400 0.0700 Depreciation and PP&E growth -0.0328 Var. Cost as % of Sales Fixed Cost as % of Sales NWC as % of sales 84.0% 4.0% 4.0% Tax rate 35% Constant Growth after 2011 Shares outstanding (1000s) 31,143 Total Cashflows by Year From Above Discount Factors PV of Cashflows Total Market Value of Equity # of Shares Outstanding Price per Share 31,143 $0.00 Sales Growth Rate 06-07' 0.14 After 2011 0.07 New investment of fixed asset growth rate 06-07' 0.66 After 2011 0.33 Actual 2004 Actual 2005 Actual 2006 Projected 2007 Projected 2008 Projected 2009 Projected 2010 Projected 2011 Projected 2012 991,974 844,998 985,419 827,752 1,664,334 1,398,041 1,780,838 1,495,904 Sales Variable Costs Gross Profit Fixed Costs Depreciation expense Financial Income Pre Tax Income Income Taxes 1,114,154 942,357 171,797 51,371 9,628 1,436 112,234 41,593 864,403 748,867 115,536 41,803 10,635 5,097 68,195 23,451 157,667 38,431 12,124 1,123,378 943,638 179,741 44,935 11,727 1,280,651 1,075,747 204,904 51,226 11,343 1,459,942 1,226,351 233,591 58,398 10,971 266,293 66,573 10,612 146,976 38,723 9,999 2,635 100,889 35,817 65,072 284,934 71,234 11,355 107,112 37,489 123,079 43,078 142,335 49,817 164,222 57,478 106,744 189, 108 66,188 202,346 70,821 Net Income 70,641 44,744 69,623 80,001 92,518 122,920 131,525 + Depreciation Operating Cash Flow 9,628 $80,269 9,999 $75,071 10,635 $55,379 12,124 $81,747 11,727 $91,728 11,343 $103,861 10.971 $117,715 10,612 $133,532 11,355 $142,879 - $ Net Investment in Net Working Capital New Investment in Fixed Assets $ $716 $ (10,588) $ (33,294) $ (9,653) $ 10,431 $ (4,830) $ - $ (8,000) $ (13,251) $ (21,947) $ (36,351) $ (60,209) $ (79,967) Total Cashflow $70,397 $32,124 $60,980 $73, 747 $78,477 $81,914 $81,364 $73,323 $62,912 Net Working Capital $164,175 $197,469 $187,038 $44,935 $51,226 $58,398 $66,573 $71,234 $ . Assumptions Cost of Capital Risk free rate Market risk premium Beta Required Return on Equity Sales Growth through 2011 0.14000.1400 0.0700 Depreciation and PP&E growth -0.0328 Var. Cost as % of Sales Fixed Cost as % of Sales NWC as % of sales 84.0% 4.0% 4.0% Tax rate 35% Constant Growth after 2011 Shares outstanding (1000s) 31,143 Total Cashflows by Year From Above Discount Factors PV of Cashflows Total Market Value of Equity # of Shares Outstanding Price per Share 31,143 $0.00 Sales Growth Rate 06-07' 0.14 After 2011 0.07 New investment of fixed asset growth rate 06-07' 0.66 After 2011 0.33Step by Step Solution
There are 3 Steps involved in it
Step: 1

Get Instant Access to Expert-Tailored Solutions
See step-by-step solutions with expert insights and AI powered tools for academic success
Step: 2

Step: 3
Ace Your Homework with AI
Get the answers you need in no time with our AI-driven, step-by-step assistance
Get Started
Political Economy Of Money And Finance 1999
Authors: Makoto Itoh, Costas Lapavitsas, Makoto Itō
1st Edition
033366521X, 9780333665213