Answered step by step
Verified Expert Solution
Link Copied!

Question

1 Approved Answer

It's a 3 part question A, B, C Suppose the following table illustrates the ages for a number of participants projected to enroll into a

It's a 3 part question A, B, C
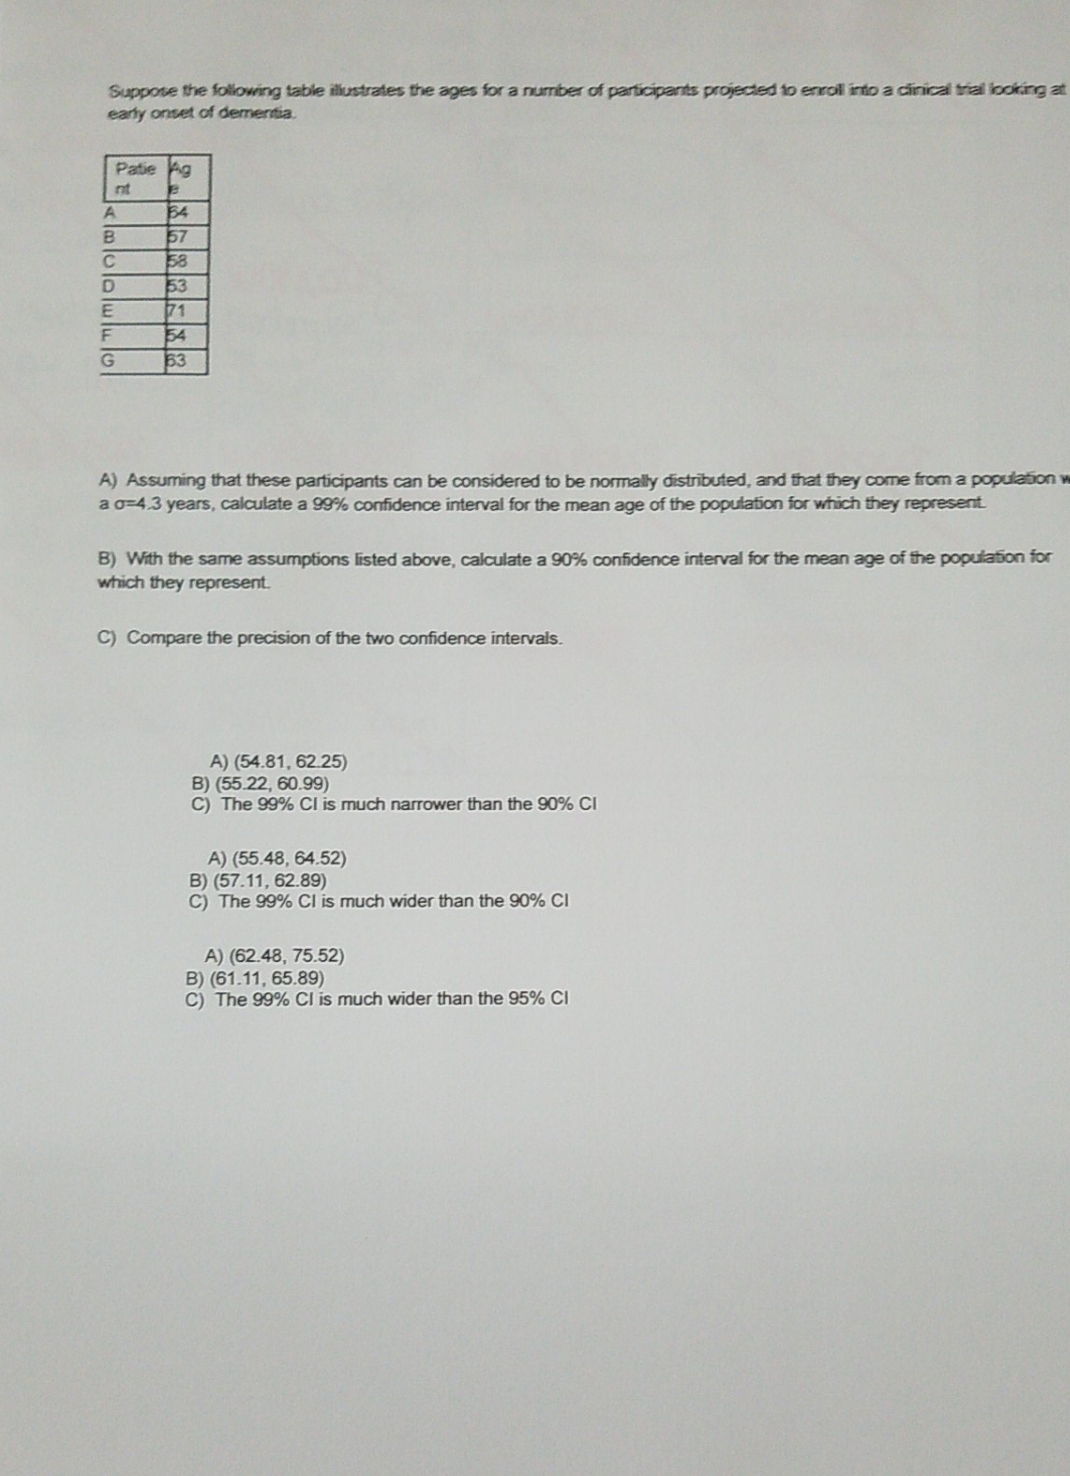
image text in transcribed
Suppose the following table illustrates the ages for a number of participants projected to enroll into a clinical trial looking at early onset of dementia. Patie Ag A) Assuming that these participants can be considered to be normally distributed, and that they come from a population a 0 4.3 years, calculate a 99% confidence interval for the mean age of the population for which they represent B) With the same assumptions listed above, calculate a 90% confidence interval for the mean age of the population for which they represent. C) Compare the precision of the two confidence intervals. A) (54.81, 62 25) B) (55.22, 60.99) C) The 99% CI is much narrower than the 90% CI A) (55.48, 64.52) B) (57.11, 62.89) C) The 99% CI is much wider than the 90% CI A) (62.48, 75.52) B) (61.11, 65.89) C) The 99% CI is much wider than the 95% CI

Step by Step Solution

There are 3 Steps involved in it

Step: 1

blur-text-image

Get Instant Access to Expert-Tailored Solutions

See step-by-step solutions with expert insights and AI powered tools for academic success

Step: 2

blur-text-image

Step: 3

blur-text-image

Ace Your Homework with AI

Get the answers you need in no time with our AI-driven, step-by-step assistance

Get Started

Recommended Textbook for

Intro Stats

Authors: Richard D. De Veaux, Paul F. Velleman, David E. Bock

3rd edition

321533283, 321533289, 9780321463708, 9780321503848, 9780321503800, 9780321499431, 9780321499417, 978-0321500458

More Books

Students also viewed these Mathematics questions