Answered step by step
Verified Expert Solution
Question
1 Approved Answer
its an advertising question. Use Table 10.1 on the separate pages to answer the following question: Tips for reading the information: The data sheet below
its an advertising question.
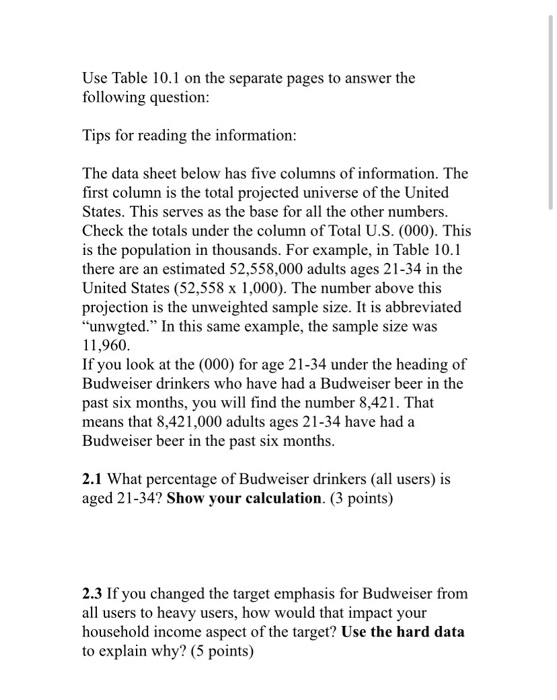
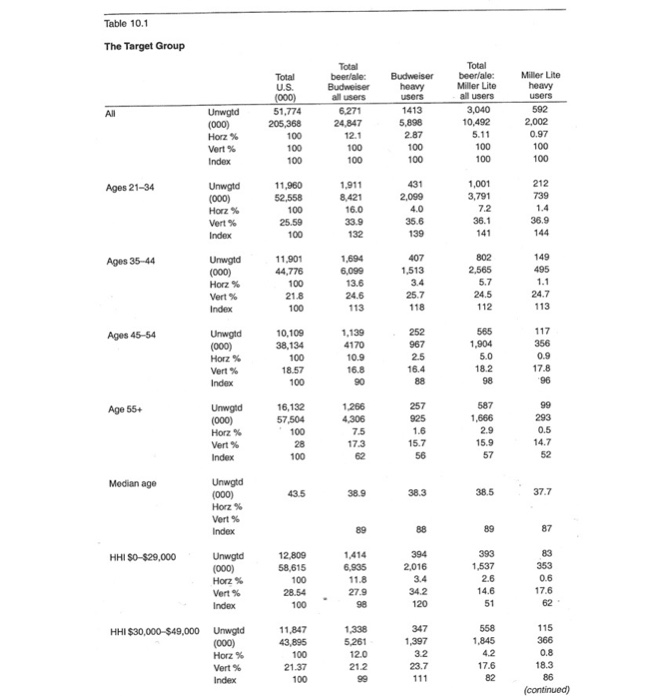
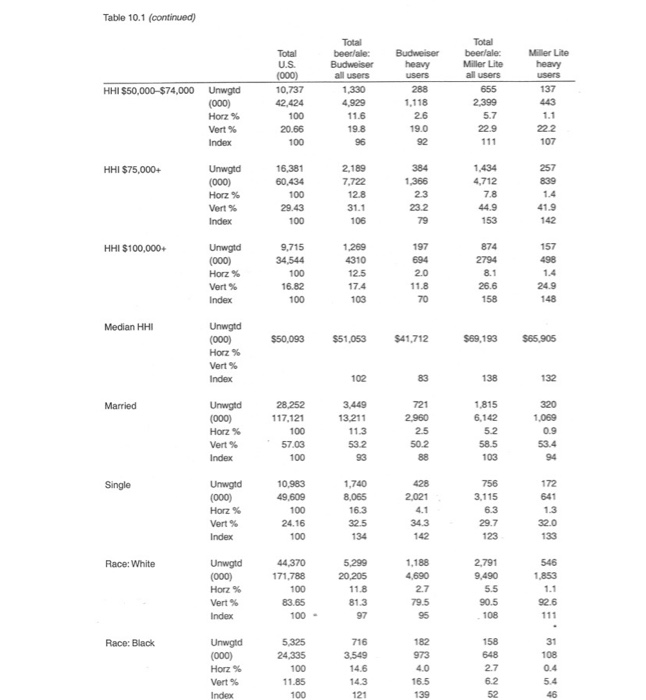
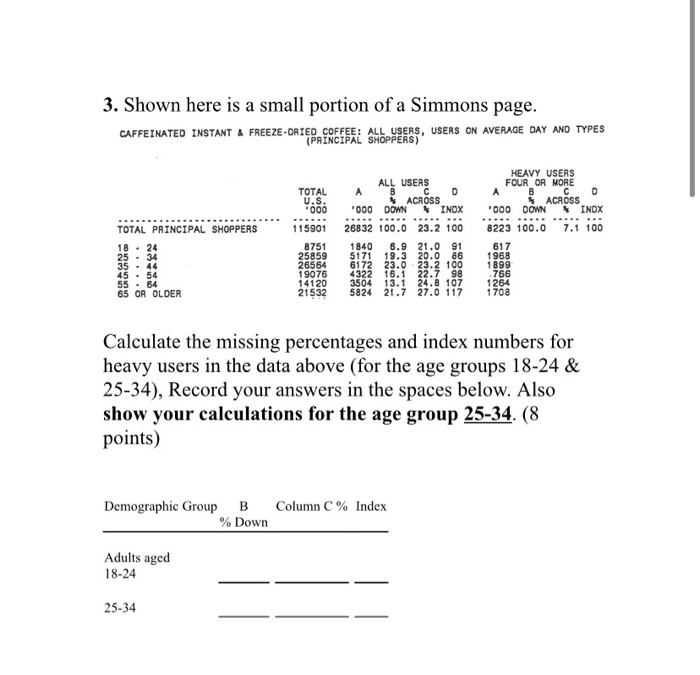
Use Table 10.1 on the separate pages to answer the following question: Tips for reading the information: The data sheet below has five columns of information. The first column is the total projected universe of the United States. This serves as the base for all the other numbers. Check the totals under the column of Total U.S. (000). This is the population in thousands. For example, in Table 10.1 there are an estimated 52,558,000 adults ages 21-34 in the United States (52,558 x 1,000). The number above this projection is the unweighted sample size. It is abbreviated "unwgted. In this same example, the sample size was 11,960. If you look at the (000) for age 21-34 under the heading of Budweiser drinkers who have had a Budweiser beer in the past six months, you will find the number 8,421. That means that 8,421,000 adults ages 21-34 have had a Budweiser beer in the past six months. 2.1 What percentage of Budweiser drinkers (all users) is aged 21-34? Show your calculation. (3 points) 2.3 If you changed the target emphasis for Budweiser from all users to heavy users, how would that impact your household income aspect of the target? Use the hard data to explain why? (5 points) Table 10.1 The Target Group Total beeriale: Budweiser all users 6.271 24.847 12.1 All Total U.S. (000) 51,774 205,368 100 100 100 Unwgtd (000) Horz % Budweiser heavy users 1413 5,898 2.87 100 100 Total beer/ale: Miller Lite all users 3,040 10.492 5.11 100 100 Miller Lite heavy users 592 2,002 0.97 100 100 Vert 100 100 Index Ages 21-34 Unwgtd (000) Horz% Vert% Index 11,960 52,558 100 25.59 100 1.911 8,421 16.0 33.9 132 431 2,099 4.0 35.6 139 1,001 3,791 7.2 36.1 141 212 739 1.4 36.9 144 Ages 35-44 407 1,513 Unwgld (000) Horz % Vert% Index 11,901 44,776 100 21.8 100 1,694 6,099 13.6 24.6 113 3.4 802 2,565 5.7 24.5 112 149 495 1.1 24.7 113 25.7 118 Ages 45-54 Unwgta (000) Horz % Vert% Index 10,109 38,134 100 18.57 100 1,139 4170 10.9 16.8 90 252 967 2.5 16.4 88 565 1.904 5.0 18.2 98 117 356 0.9 17.8 96 Age 55+ Uniwgtd (000) Horz % Vert% Index 16,132 57,504 100 28 100 1.256 4,306 7.5 17.3 257 925 1.6 15.7 56 587 1,666 2.9 15.9 57 99 293 0.5 14.7 52 Median age 43.5 38.9 38.3 38.5 37.7 Unwgtd (000) Horz% Vert% Index 88 89 87 HHI $0-$29,000 Unwgtd (000) Horz % Vert% Index 12,809 58,615 100 28.54 100 1.414 6.935 11.8 27.9 98 394 2,016 3.4 34.2 393 1,537 2.6 14.6 51 83 353 0.6 17.6 62 120 568 1,845 HHI $30,000-$49,000 Unwgtd (000) Horz % Vert% Index 11,847 43,895 100 21.37 100 1,338 5.261 12.0 212 99 347 1,397 32 23.7 111 115 366 0.8 18.3 86 (continued) 17.6 82 Table 10.1 (continued) Total beeriale: Miller Lite all users HHI $50,000-$74,000 Unwgtd (000) Horz % Vert% Index 655 Total beeriale: Budweiser all users 1,330 4.929 11.6 19.8 96 Total U.S (000) 10,737 42,424 100 20.66 100 Budweiser heavy users 288 1,118 26 19.0 92 Miller Lite heavy users 137 443 1.1 222 107 2,399 5.7 22.9 HHI $75,000+ Unwgtd (000) Horz % Vert% Index 16,381 60.434 100 29.43 100 2,189 7,722 12.8 31.1 106 384 1,366 23 23.2 79 1.434 4,712 7.8 257 839 1.4 41.9 142 153 HHI $100,000 157 498 Unwgta (000) Horz % Vert% Index 9,715 34,544 100 16.82 100 1.269 4310 12.5 17.4 103 197 694 2.0 11.8 70 874 2794 8.1 26.6 158 24.9 148 Median HHI $50,093 $51,053 $41,712 $69,193 $65.905 Unwgtd (000) Horz % Vert% Index 102 83 138 132 Married Unwgtd (000) Horz % Vert Index 28.252 117,121 100 57.03 100 3,449 13.211 11.3 53.2 93 721 2.960 2.5 50.2 88 1,815 6.142 52 58.5 103 320 1.069 0.9 53.4 Single Unwgtd (000) Horz % Vert% Index 10.983 49,609 100 24.16 100 1,740 8,065 16.3 32.5 134 428 2,021 4.1 34.3 142 756 3,115 6.3 29.7 123 172 641 1.3 320 133 Race: White 546 1,853 Unwgtd (000) Horz % Vert% Index 44,370 171,788 100 83.65 100 - 5,299 20,205 11.8 81.3 97 1,188 4,690 2.7 79.5 95 2,791 9,490 5.5 90.5 108 92.6 111 ace: Bla Unwgtd (000) Horz % Vert% Index 5,325 24,335 100 11.85 100 716 3,549 14.6 14.3 121 182 973 4.0 16.5 139 158 648 2.7 6.2 52 31 108 0.4 5.4 46 3. Shown here is a small portion of a Simmons page. CAFFEINATED INSTANT & FREEZE-DRIED COFFEE: ALL USERS, USERS ON AVERAGE DAY AND TYPES (PAINCIPAL SHOPPERS) TOTAL U.S. "000 TOTAL PRINCIPAL SHOPPERS 18 . 24 25 - 34 35.44 45.54 55 . 64 65 OR OLDER 115901 8751 25859 26564 19076 14120 21532 ALL USERS A B D ACROSS 000 DOWN INOX 26832 100.0 23.2 100 1840 6.9 21.0 91 5171 19.3 20.0 86 6172 23.0 23.2 100 4322 16.1 22.7 98 3504 13.1 24.8 107 5824 21.7 27.0 117 HEAVY USERS FOUR OR MORE A B C D % ACROSS "000 DOWN * INOX 8223 100.0 7.1 100 617 1968 1899 766 1264 1708 Calculate the missing percentages and index numbers for heavy users in the data above (for the age groups 18-24 & 25-34), Record your answers in the spaces below. Also show your calculations for the age group 25-34. (8 points) Demographic Group B % Down Column C % Index Adults aged 18-24 25-34 Use Table 10.1 on the separate pages to answer the following question: Tips for reading the information: The data sheet below has five columns of information. The first column is the total projected universe of the United States. This serves as the base for all the other numbers. Check the totals under the column of Total U.S. (000). This is the population in thousands. For example, in Table 10.1 there are an estimated 52,558,000 adults ages 21-34 in the United States (52,558 x 1,000). The number above this projection is the unweighted sample size. It is abbreviated "unwgted. In this same example, the sample size was 11,960. If you look at the (000) for age 21-34 under the heading of Budweiser drinkers who have had a Budweiser beer in the past six months, you will find the number 8,421. That means that 8,421,000 adults ages 21-34 have had a Budweiser beer in the past six months. 2.1 What percentage of Budweiser drinkers (all users) is aged 21-34? Show your calculation. (3 points) 2.3 If you changed the target emphasis for Budweiser from all users to heavy users, how would that impact your household income aspect of the target? Use the hard data to explain why? (5 points) Table 10.1 The Target Group Total beeriale: Budweiser all users 6.271 24.847 12.1 All Total U.S. (000) 51,774 205,368 100 100 100 Unwgtd (000) Horz % Budweiser heavy users 1413 5,898 2.87 100 100 Total beer/ale: Miller Lite all users 3,040 10.492 5.11 100 100 Miller Lite heavy users 592 2,002 0.97 100 100 Vert 100 100 Index Ages 21-34 Unwgtd (000) Horz% Vert% Index 11,960 52,558 100 25.59 100 1.911 8,421 16.0 33.9 132 431 2,099 4.0 35.6 139 1,001 3,791 7.2 36.1 141 212 739 1.4 36.9 144 Ages 35-44 407 1,513 Unwgld (000) Horz % Vert% Index 11,901 44,776 100 21.8 100 1,694 6,099 13.6 24.6 113 3.4 802 2,565 5.7 24.5 112 149 495 1.1 24.7 113 25.7 118 Ages 45-54 Unwgta (000) Horz % Vert% Index 10,109 38,134 100 18.57 100 1,139 4170 10.9 16.8 90 252 967 2.5 16.4 88 565 1.904 5.0 18.2 98 117 356 0.9 17.8 96 Age 55+ Uniwgtd (000) Horz % Vert% Index 16,132 57,504 100 28 100 1.256 4,306 7.5 17.3 257 925 1.6 15.7 56 587 1,666 2.9 15.9 57 99 293 0.5 14.7 52 Median age 43.5 38.9 38.3 38.5 37.7 Unwgtd (000) Horz% Vert% Index 88 89 87 HHI $0-$29,000 Unwgtd (000) Horz % Vert% Index 12,809 58,615 100 28.54 100 1.414 6.935 11.8 27.9 98 394 2,016 3.4 34.2 393 1,537 2.6 14.6 51 83 353 0.6 17.6 62 120 568 1,845 HHI $30,000-$49,000 Unwgtd (000) Horz % Vert% Index 11,847 43,895 100 21.37 100 1,338 5.261 12.0 212 99 347 1,397 32 23.7 111 115 366 0.8 18.3 86 (continued) 17.6 82 Table 10.1 (continued) Total beeriale: Miller Lite all users HHI $50,000-$74,000 Unwgtd (000) Horz % Vert% Index 655 Total beeriale: Budweiser all users 1,330 4.929 11.6 19.8 96 Total U.S (000) 10,737 42,424 100 20.66 100 Budweiser heavy users 288 1,118 26 19.0 92 Miller Lite heavy users 137 443 1.1 222 107 2,399 5.7 22.9 HHI $75,000+ Unwgtd (000) Horz % Vert% Index 16,381 60.434 100 29.43 100 2,189 7,722 12.8 31.1 106 384 1,366 23 23.2 79 1.434 4,712 7.8 257 839 1.4 41.9 142 153 HHI $100,000 157 498 Unwgta (000) Horz % Vert% Index 9,715 34,544 100 16.82 100 1.269 4310 12.5 17.4 103 197 694 2.0 11.8 70 874 2794 8.1 26.6 158 24.9 148 Median HHI $50,093 $51,053 $41,712 $69,193 $65.905 Unwgtd (000) Horz % Vert% Index 102 83 138 132 Married Unwgtd (000) Horz % Vert Index 28.252 117,121 100 57.03 100 3,449 13.211 11.3 53.2 93 721 2.960 2.5 50.2 88 1,815 6.142 52 58.5 103 320 1.069 0.9 53.4 Single Unwgtd (000) Horz % Vert% Index 10.983 49,609 100 24.16 100 1,740 8,065 16.3 32.5 134 428 2,021 4.1 34.3 142 756 3,115 6.3 29.7 123 172 641 1.3 320 133 Race: White 546 1,853 Unwgtd (000) Horz % Vert% Index 44,370 171,788 100 83.65 100 - 5,299 20,205 11.8 81.3 97 1,188 4,690 2.7 79.5 95 2,791 9,490 5.5 90.5 108 92.6 111 ace: Bla Unwgtd (000) Horz % Vert% Index 5,325 24,335 100 11.85 100 716 3,549 14.6 14.3 121 182 973 4.0 16.5 139 158 648 2.7 6.2 52 31 108 0.4 5.4 46 3. Shown here is a small portion of a Simmons page. CAFFEINATED INSTANT & FREEZE-DRIED COFFEE: ALL USERS, USERS ON AVERAGE DAY AND TYPES (PAINCIPAL SHOPPERS) TOTAL U.S. "000 TOTAL PRINCIPAL SHOPPERS 18 . 24 25 - 34 35.44 45.54 55 . 64 65 OR OLDER 115901 8751 25859 26564 19076 14120 21532 ALL USERS A B D ACROSS 000 DOWN INOX 26832 100.0 23.2 100 1840 6.9 21.0 91 5171 19.3 20.0 86 6172 23.0 23.2 100 4322 16.1 22.7 98 3504 13.1 24.8 107 5824 21.7 27.0 117 HEAVY USERS FOUR OR MORE A B C D % ACROSS "000 DOWN * INOX 8223 100.0 7.1 100 617 1968 1899 766 1264 1708 Calculate the missing percentages and index numbers for heavy users in the data above (for the age groups 18-24 & 25-34), Record your answers in the spaces below. Also show your calculations for the age group 25-34. (8 points) Demographic Group B % Down Column C % Index Adults aged 18-24 25-34 Step by Step Solution
There are 3 Steps involved in it
Step: 1

Get Instant Access to Expert-Tailored Solutions
See step-by-step solutions with expert insights and AI powered tools for academic success
Step: 2

Step: 3

Ace Your Homework with AI
Get the answers you need in no time with our AI-driven, step-by-step assistance
Get Started


