Answered step by step
Verified Expert Solution
Link Copied!

Question

1 Approved Answer

its matlab question, the answer figure has to be the exactly same as given Suppose we enter the following two vectors in Matlab: satisfaction_class1 satisfaction_class2

its matlab question, the answer figure has to be the exactly same as given image text in transcribed
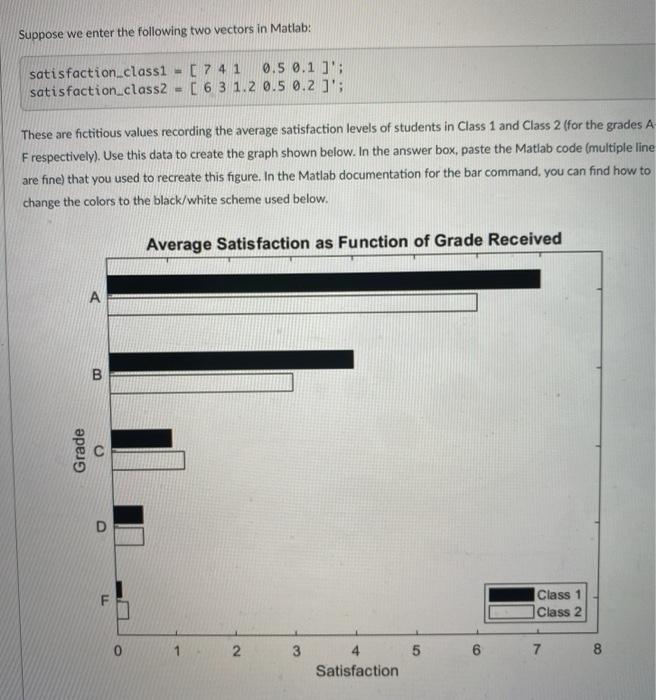
Suppose we enter the following two vectors in Matlab: satisfaction_class1 satisfaction_class2 [ 741 0.5 0.1 ]': [ 6 3 1.2 0.5 0.2 ]'; These are fictitious values recording the average satisfaction levels of students in Class 1 and Class 2 (for the grades A- Frespectively). Use this data to create the graph shown below. In the answer box, paste the Matlab code (multiple line are fine) that you used to recreate this figure. In the Matlab documentation for the bar command, you can find how to change the colors to the black/white scheme used below. Average Satisfaction as Function of Grade Received 00 Grade Class 1 Class 2 0 1 2. 3 5 6 7 8 4 Satisfaction

Step by Step Solution

There are 3 Steps involved in it

Step: 1

blur-text-image

Get Instant Access to Expert-Tailored Solutions

See step-by-step solutions with expert insights and AI powered tools for academic success

Step: 2

blur-text-image

Step: 3

blur-text-image

Ace Your Homework with AI

Get the answers you need in no time with our AI-driven, step-by-step assistance

Get Started

Recommended Textbook for

Database And Expert Systems Applications 33rd International Conference Dexa 2022 Vienna Austria August 22 24 2022 Proceedings Part 1 Lncs 13426

Authors: Christine Strauss ,Alfredo Cuzzocrea ,Gabriele Kotsis ,A Min Tjoa ,Ismail Khalil

1st Edition

3031124227, 978-3031124228

More Books

Students also viewed these Databases questions