
 Its not C. Please help
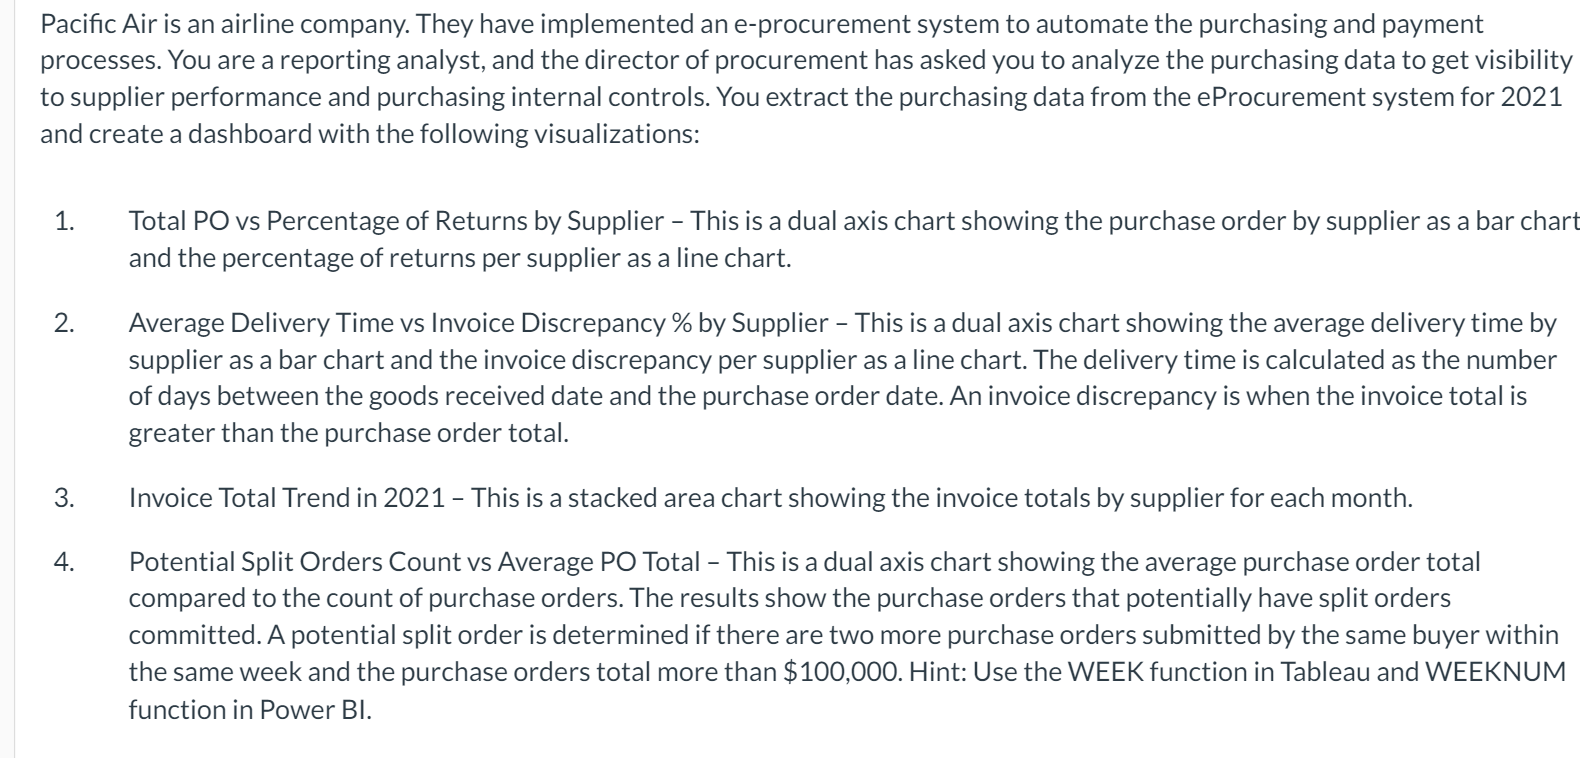
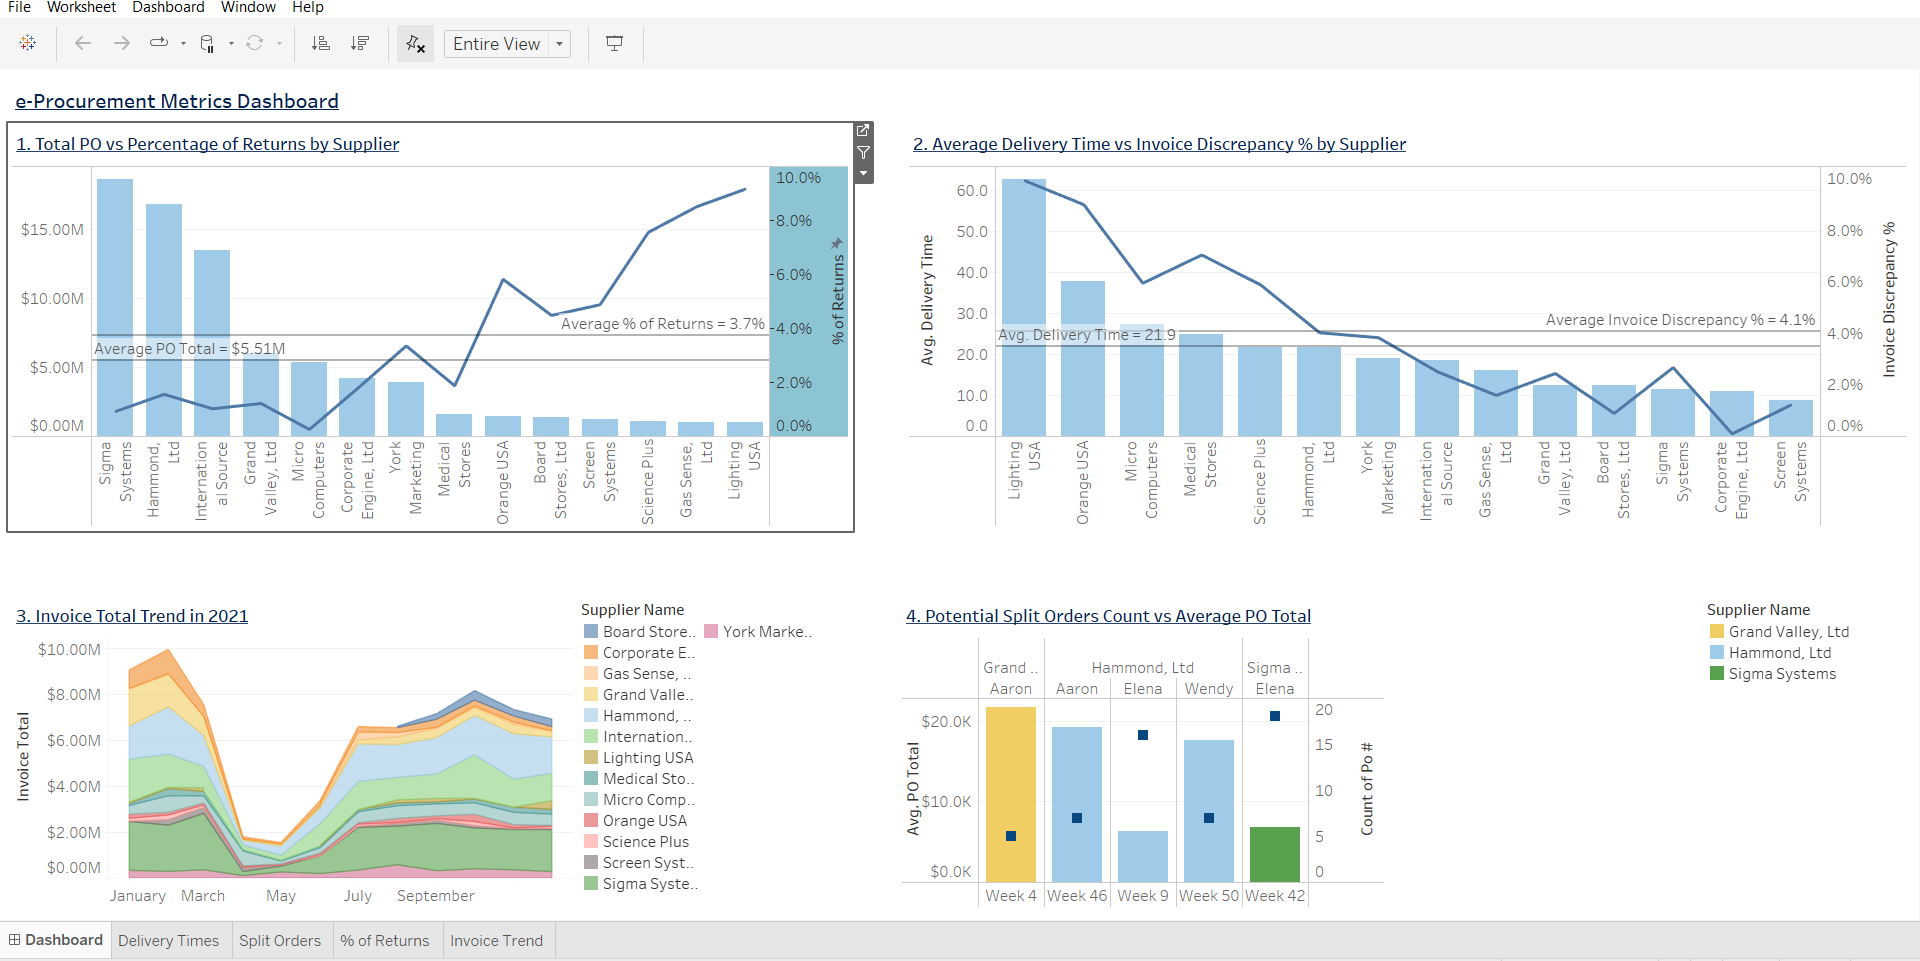
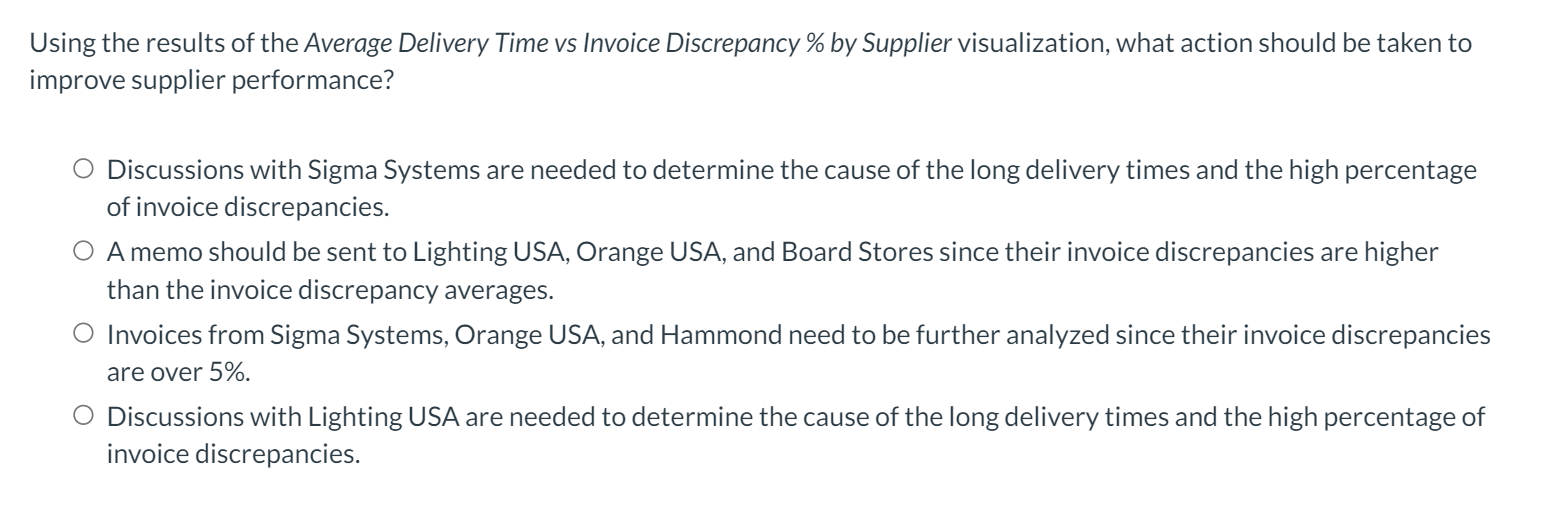
Pacific Air is an airline company. They have implemented an e-procurement system to automate the purchasing and payment processes. You are a reporting analyst, and the director of procurement has asked you to analyze the purchasing data to get visibility to supplier performance and purchasing internal controls. You extract the purchasing data from the eProcurement system for 2021 and create a dashboard with the following visualizations: 1. Total PO vs Percentage of Returns by Supplier - This is a dual axis chart showing the purchase order by supplier as a bar chart and the percentage of returns per supplier as a line chart. 2. Average Delivery Time vs Invoice Discrepancy % by Supplier - This is a dual axis chart showing the average delivery time by supplier as a bar chart and the invoice discrepancy per supplier as a line chart. The delivery time is calculated as the number of days between the goods received date and the purchase order date. An invoice discrepancy is when the invoice total is greater than the purchase order total. 3. Invoice Total Trend in 2021 - This is a stacked area chart showing the invoice totals by supplier for each month. - 4. Potential Split Orders Count vs Average PO Total - This is a dual axis chart showing the average purchase order total compared to the count of purchase orders. The results show the purchase orders that potentially have split orders committed. A potential split order is determined if there are two more purchase orders submitted by the same buyer within the same week and the purchase orders total more than $100,000. Hint: Use the WEEK function in Tableau and WEEKNUM function in Power BI. File Worksheet Dashboard Window Help 1 I Entire View e-Procurement Metrics Dashboard 1. Total PO vs Percentage of Returns by Supplier 2. Average Delivery Time vs Invoice Discrepancy % by Supplier 10.096 10.0% 60.0 -8.096 $15.00M 50.0 8.09 -6.0% 40.0 6.096 $10.00M % of Returns Avg. Delivery Time Invoice Discrepancy % 30.0 Average % of Returns = 3.7% -4.0% Average Invoice Discrepancy % = 4.1% Avg. Delivery Time = 21.9 4.096 Average PO Total = $5.51M 20.0 $5.00M -2.0% 2.0% 10.0 $0.00M 0.0% 0.0 0.0 277 Ltd min USA USA Sigma Systems Hammond, al Source Internation Grand Micro Valley, Ltd Computers Medical Stores Corpora York Engine, Ltd Marketing P77' Orange USA Board Stores, Ltd Screen Systems Science Plus Lighting Lighting Gas Sense Orange USA Micro Computers Medical Stores Science Plus Ltd Hammond, York Marketing Internation al Source Gas Sense, Grand Valley, Ltd Board Stores, Lt Sigma Systems Corporate Engine, Ltd Screen Systems 3. Invoice Total Trend in 2021 4. Potential Split Orders Count vs Average PO Total $10.00M Supplier Name Grand Valley, Ltd Hammond, Ltd Sigma Systems Grand Aaron Hammond, Ltd Sigma Aaron Elena Wendy Elena $8.00M 20 $20.OK $6.00M Supplier Name Board Store.. York Marke.. Corporate E. Gas Sense, .. Grand Valle. Hammond, .. Internation.. Lighting USA Medical Sto. Micro Comp. Orange USA Science Plus Screen Syst.. Sigma Syste. 15 Invoice Total $4.00M Avg, PO Total 10 Count of Po# $10.OK $2.00M $0.OK $0.00M January March May July September Week 4 Week 46 Week 9 Week 50 Week 42 Dashboard Delivery Times Split Orders % of Returns Invoice Trend Using the results of the Average Delivery Time vs Invoice Discrepancy % by Supplier visualization, what action should be taken to improve supplier performance? O Discussions with Sigma Systems are needed to determine the cause of the long delivery times and the high percentage of invoice discrepancies. O A memo should be sent to Lighting USA, Orange USA, and Board Stores since their invoice discrepancies are higher than the invoice discrepancy averages. O Invoices from Sigma Systems, Orange USA, and Hammond need to be further analyzed since their invoice discrepancies are over 5%. O Discussions with Lighting USA are needed to determine the cause of the long delivery times and the high percentage of invoice discrepancies


 Its not C. Please help


