Its probably safe to say that theres nothing more important in determining a bonds rating than the underlying financial condition and operating results of the company issuing the bond. Just as financial ratios can be used in the analysis of common stocks, they can also be used in the analysis of bondsa process we refer to as credit analysis. In credit analysis, attention is directed toward the basic liquidity and profitability of the firm, the extent to which the firm employs debt, and the ability of the firm to service its debt.


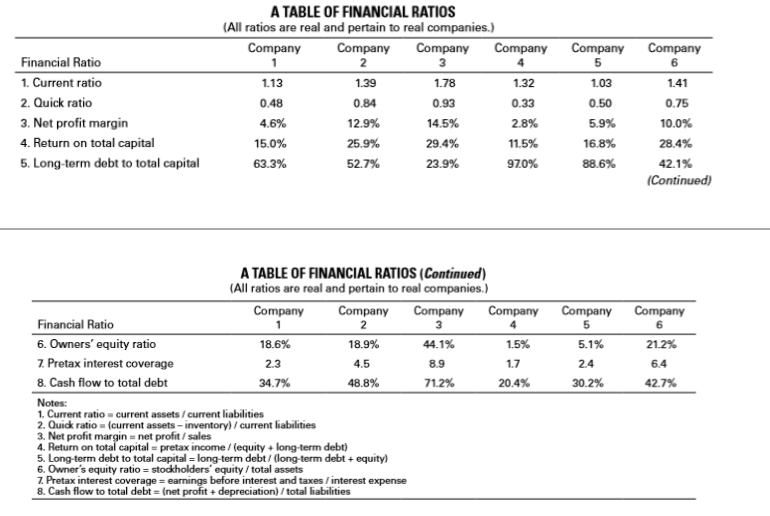
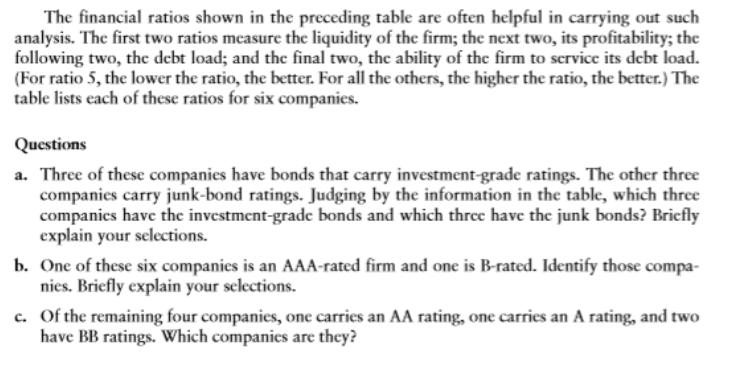
A TABLE OF FINANCIAL RATIOS (All ratios are real and pertain to real companies.) Company Company Company Company Company Company Financial Ratio 1. Current ratio 2. Quick ratio 3. Net profit margin 4. Return on total capital 5. Long-term debt to total capital 1.13 0.48 4.6% 15.0% 63.3% 0.84 12.9% 25.9% 52.7% 3 1.78 0.93 14.5% 29.4% 23.9% 1.32 0.33 2.8% 11.5% 970% 5 1.03 0.50 5.9% 16.8% 88.6% 6 1.41 0.75 10.0% 28.4% 42.1% A TABLE OF FINANCIAL RATIOS (Continued) (All ratios are real and pertain to real companies. Company Company Company Company Company Company Financial Ratio 6. Owners equity ratio 7 Pretax interest coverage 8. Cash flow to total debt 5 51% 2.4 30.2% 6 21.2% 6.4 42.7% 44.1% 18.6% 2.3 34.7% 18.9% 4.5 48.8% 1.5% 1.7 20.4% 8.9 1 Current ratio current assets/ current liabilities 2. Quick ratio (current assets- inventory)/current liabilities 3. Net profit margin = net profit , sales 4. Return on total capital pretax income /(equity long-term debt) 5. Long-term debt to total capital long-term debt/(long-term debtequity) 6. Owner's equity ratio stockholders' equity/total assets 7 Pretax interest coverage earnings before interest and taxes /interest expense 8. Cash flow to total debt (net profit+depreciation)/ total liabilities The financial ratios shown in the preceding table are often helpful in carrying out such analysis. The first two ratios measure the liquidity of the firm; the next two, its profitability; the following two, the debt load; and the final two, the ability of the firm to service its debt load. (For ratio 5, the lower the ratio, the better. For all the others, the higher the ratio, the better.) The table lists each of these ratios for six companies Questions a. Three of these companies have bonds that carry investment-grade ratings. The other three companies carry junk-bond ratings. Judging by the information in the table, which three companics have the investment-grade bonds and which three have the junk bonds? Briefly explain your selections nies. Briefly explain your selections. have BB ratings. Which companies are they? b. One of these six companies is an AAA-rated firm and one is B-rated. Identify those compa- c. Of the remaining four companies, one carries an AA rating, one carries an A rating, and two A TABLE OF FINANCIAL RATIOS (All ratios are real and pertain to real companies.) Company Company Company Company Company Company Financial Ratio 1. Current ratio 2. Quick ratio 3. Net profit margin 4. Return on total capital 5. Long-term debt to total capital 1.13 0.48 4.6% 15.0% 63.3% 0.84 12.9% 25.9% 52.7% 3 1.78 0.93 14.5% 29.4% 23.9% 1.32 0.33 2.8% 11.5% 970% 5 1.03 0.50 5.9% 16.8% 88.6% 6 1.41 0.75 10.0% 28.4% 42.1% A TABLE OF FINANCIAL RATIOS (Continued) (All ratios are real and pertain to real companies. Company Company Company Company Company Company Financial Ratio 6. Owners equity ratio 7 Pretax interest coverage 8. Cash flow to total debt 5 51% 2.4 30.2% 6 21.2% 6.4 42.7% 44.1% 18.6% 2.3 34.7% 18.9% 4.5 48.8% 1.5% 1.7 20.4% 8.9 1 Current ratio current assets/ current liabilities 2. Quick ratio (current assets- inventory)/current liabilities 3. Net profit margin = net profit , sales 4. Return on total capital pretax income /(equity long-term debt) 5. Long-term debt to total capital long-term debt/(long-term debtequity) 6. Owner's equity ratio stockholders' equity/total assets 7 Pretax interest coverage earnings before interest and taxes /interest expense 8. Cash flow to total debt (net profit+depreciation)/ total liabilities The financial ratios shown in the preceding table are often helpful in carrying out such analysis. The first two ratios measure the liquidity of the firm; the next two, its profitability; the following two, the debt load; and the final two, the ability of the firm to service its debt load. (For ratio 5, the lower the ratio, the better. For all the others, the higher the ratio, the better.) The table lists each of these ratios for six companies Questions a. Three of these companies have bonds that carry investment-grade ratings. The other three companies carry junk-bond ratings. Judging by the information in the table, which three companics have the investment-grade bonds and which three have the junk bonds? Briefly explain your selections nies. Briefly explain your selections. have BB ratings. Which companies are they? b. One of these six companies is an AAA-rated firm and one is B-rated. Identify those compa- c. Of the remaining four companies, one carries an AA rating, one carries an A rating, and two


