It's so confusing.
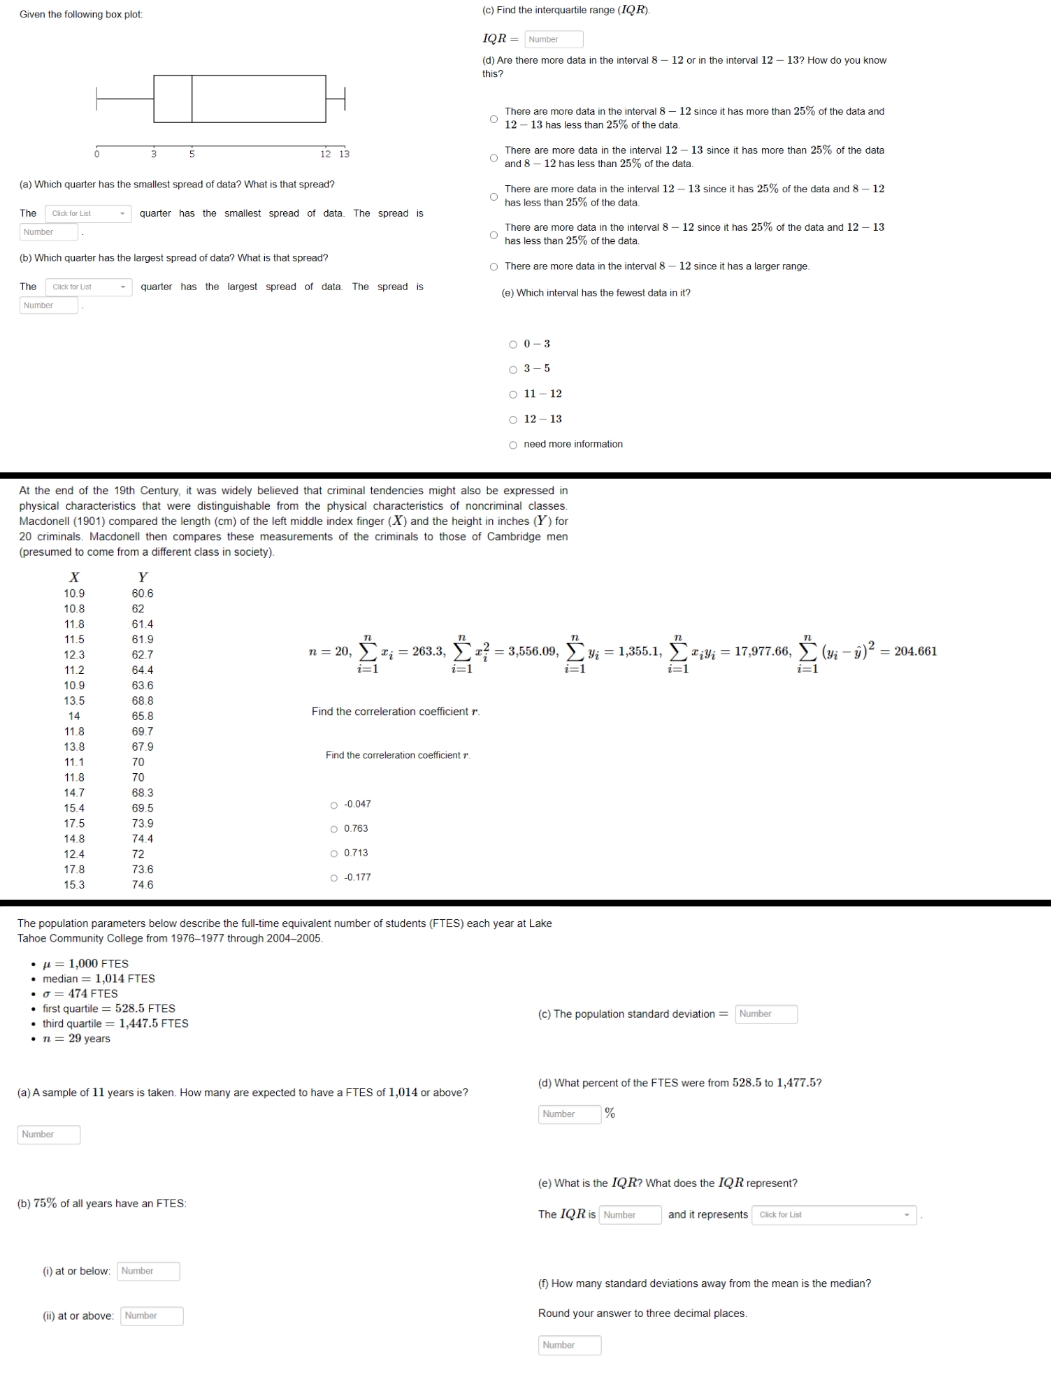
Given the following box plot: (c) Find the interquartile range (IQ R). IQR = Number (d) Are there more data in the interval 8 - 12 or in the interval 12 - 13? How do you know this? There are more data in the interval 8 - 12 since it has more than 25% of the data and 12 - 13 has less than 25% of the data. 12 13 There are more data in the interval 12 - 13 since it has more than 25% of the data and 8 - 12 has less than 25% of the data. (a) Which quarter has the smallest spread of data? What is that spread? There are more data in the interval 12 - 13 since it has 25% of the data and 8 - 12 has less than 25% of the data. The Cack for List quarter has the smallest spread of data. The spread is Number re are more data in the interval 8 - 12 since it has 25% of the data and 12 - 13 has less than 25% of the data. (b) Which quarter has the largest spread of data? What is that spread? O There are more data in the interval 8 - 12 since it has a larger range The Click for List quarter has the largest spread of data. The spread is (e) Which interval has the fewest data in it? Number 0 0-3 0 3-5 O 11 -12 O 12 - 13 O need more information At the end of the 19th Century, it was widely believed that criminal tendencies might also be expressed in physical characteristics that were distinguishable from the physical characteristics of noncriminal classes. Macdonell (1901) compared the length (cm) of the left middle index finger (X) and the height in inches (Y) for 20 criminals. Macdonell then compares these measurements of the criminals to those of Cambridge men (presumed to come from a different class in society) A Y 10.9 60.6 10 8 62 11.8 61.4 11.5 61.9 12 3 62 7 n = 20, > x; = 263.3, > x? = 3,556.09, > y; = 1,355.1, Ex,y; = 17,977.66, > (vi -3)2 = 204.661 11.2 64.4 1=1 1=1 10.9 63.6 13.5 68 8 14 65.8 Find the correleration coefficient r. 11.8 69 7 13.8 67.9 11.1 70 Find the correleration coefficient r. 11.8 70 14.7 68.3 15.4 69.5 O -0.047 17.5 73.9 14.8 O 0.763 12.4 72 6 0.713 17.8 73.6 15.3 74.6 O -0.177 The population parameters below describe the full-time equivalent number of students (FTES) each year at Lake Tahoe Community College from 1976-1977 through 2004-2005. # = 1,000 FTES median = 1,014 FTES = 474 FTES first quartile = 528.5 FTES third quartile = 1,447.5 FTES (c) The population standard deviation = Number n = 29 years (a) A sample of 11 years is taken. How many are expected to have a FTES of 1,014 or above? (d) What percent of the FTES were from 528.5 to 1,477.5? Number % Number (e) What is the IQR? What does the IQR represent? (b) 75% of all years have an FTES: The IQR is Number and it represents Click for List (i) at or below: Number (f) How many standard deviations away from the mean is the median? (ii) at or above: Number Round your answer to three decimal places. Number