Answered step by step
Verified Expert Solution
Question
1 Approved Answer
I've asked this question before, but I am still confused Vestas is concerned about the higher interest rate (8%) that NC Bank charges on the


I've asked this question before, but I am still confused
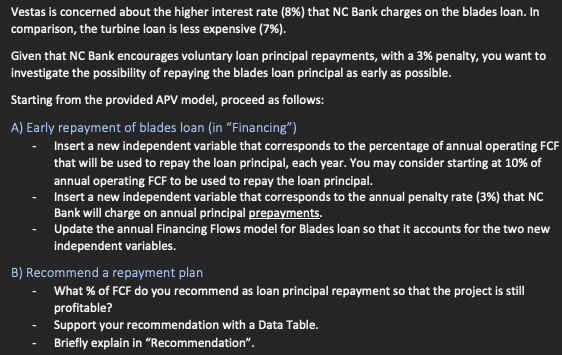
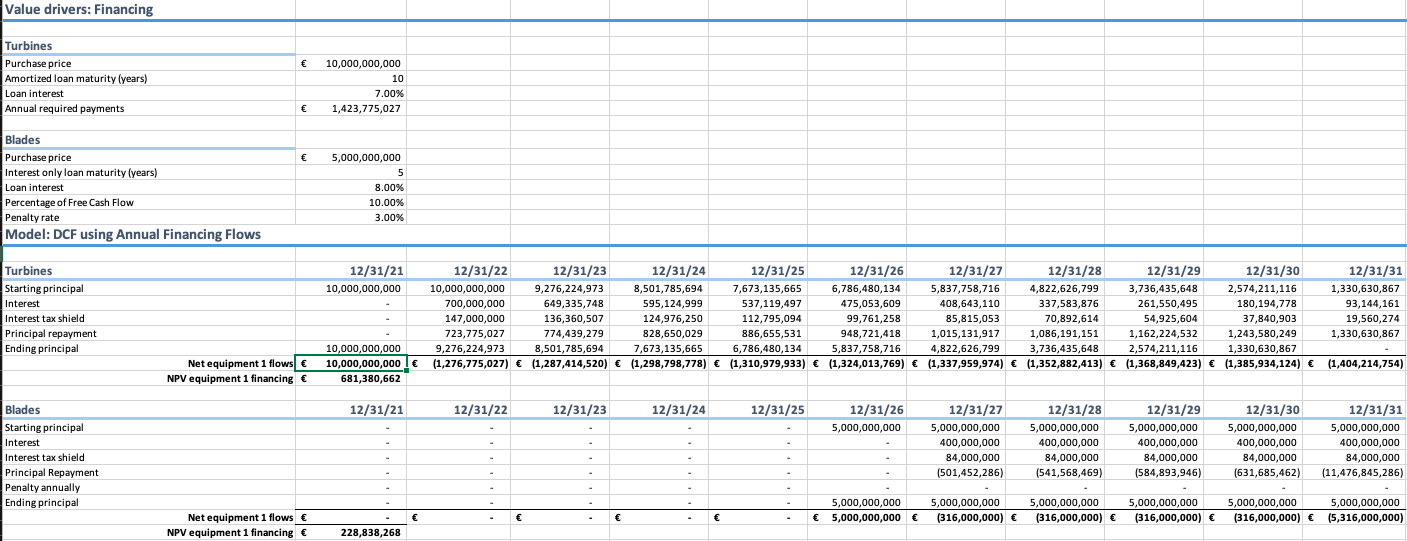
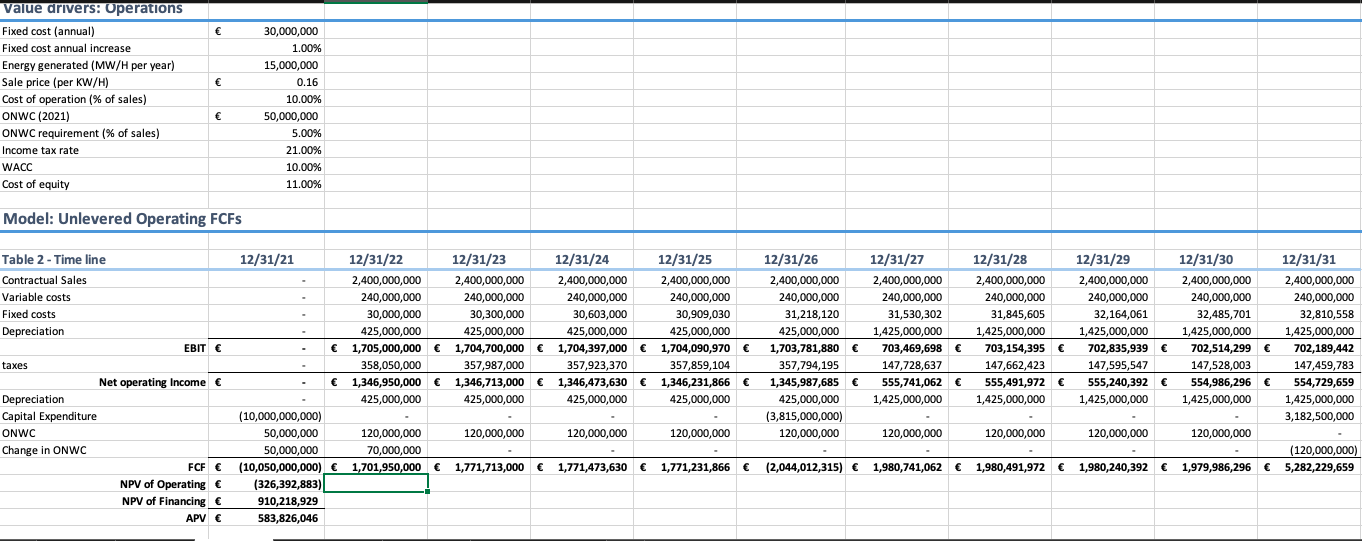
Vestas is concerned about the higher interest rate (8%) that NC Bank charges on the blades loan. In comparison, the turbine loan is less expensive (7%). Given that NC Bank encourages voluntary loan principal repayments, with a 3% penalty, you want to investigate the possibility of repaying the blades loan principal as early as possible. Starting from the provided APV model, proceed as follows: A) Early repayment of blades loan (in "Financing") Insert a new independent variable that corresponds to the percentage of annual operating FCF that will be used to repay the loan principal, each year. You may consider starting at 10% of annual operating FCF to be used to repay the loan principal. Insert a new independent variable that corresponds to the annual penalty rate (3%) that NC Bank will charge on annual principal prepayments. Update the annual Financing Flows model for Blades loan so that it accounts for the two new independent variables. B) Recommend a repayment plan What % of FCF do you recommend as loan principal repayment so that the project is still profitable? Support your recommendation with a Data Table. Briefly explain in "Recommendation". Value drivers: Financing Turbines Purchase price Amortized loan maturity (years) Loan interest Annual required payments 10,000,000,000 10 7.00% 1,423,775,027 Blades Purchase price Interest only loan maturity (years) Loan interest Percentage of Free Cash Flow Penalty rate Model: DCF using Annual Financing Flows 5,000,000,000 5 8.00% 10.00% 3.00% 12/31/21 10,000,000,000 Turbines Starting principal Interest Interest tax shield Principal repayment Ending principal 12/31/22 12/31/23 12/31/24 12/31/25 12/31/26 12/31/27 12/31/28 12/31/29 12/31/30 10,000,000,000 9,276,224,973 8,501,785,694 7,673,135,665 6,786,480,134 5,837,758,716 4,822,626,799 3,736,435,648 2,574,211,116 700,000,000 649,335,748 595,124,999 537,119,497 475,053,609 408,643,110 337,583,876 261,550,495 180,194,778 147,000,000 136,360,507 124,976,250 112,795,094 99,761,258 85,815,053 70,892,614 54,925,604 37,840,903 723,775,027 774,439,279 828,650,029 886,655,531 948,721,418 1,015,131,917 1,086,191, 151 1,162,224,532 1,243,580,249 9,276,224,973 8,501,785,694 7.673,135,665 6.786,480,134 5.837,758,716 4,822,626,799 3,736,435,648 2,574,211,116 1,330,630,867 (1,276,775,027) (1,287,414,520) (1,298,798,778) (1,310,979,933) (1,324,013,769) (1,337,959,974) (1,352,882,413) (1,368,849,423) (1,385,934,124) 12/31/31 1,330,630,867 93,144,161 19,560,274 1,330,630,867 10,000,000,000 10,000,000,000 681,380.662 Net equipment 1 flows NPV equipment 1 financing (1,404,214,754) 12/31/21 12/31/22 12/31/23 12/31/24 12/31/25 12/31/26 5,000,000,000 Blades Starting principal Interest Interest tax shield Principal Repayment Penalty annually Ending principal 12/31/27 5,000,000,000 400,000,000 84,000,000 (501,452,286) 12/31/28 5,000,000,000 400,000,000 84,000,000 (541,568,469) 12/31/29 5,000,000,000 400,000,000 84,000,000 (584,893,946) 12/31/30 5,000,000,000 400,000,000 84,000,000 (631,685,462) 12/31/31 5,000,000,000 400,000,000 84,000,000 (11,476,845,286) 5,000,000,000 5,000,000,000 5,000,000,000 (316,000,000) 5,000,000,000 (316,000,000) 5,000,000,000 (316,000,000) 5,000,000,000 (316,000,000) 5,000,000,000 (5,316,000,000) Net equipment 1 flows NPV equipment 1 financing 228,838,268 value drivers: Operations Fixed cost (annual) Fixed cost annual increase Energy generated (MW/H per year) Sale price (per kW/H) Cost of operation (% of sales) ONWC (2021) ONWC requirement (% of sales) Income tax rate WACC Cost of equity 30,000,000 1.00% 15,000,000 0.16 10.00% 50,000,000 5.00% 21.00% 10.00% 11.00% Model: Unlevered Operating FCFs Table 2 - Time line Contractual Sales Variable costs Fixed costs Depreciation EBIT taxes Net operating Income Depreciation Capital Expenditure ONWC Change in ONWC FCF NPV of Operating NPV of Financing APV 12/31/21 12/31/22 12/31/23 12/31/24 12/31/25 2,400,000,000 2,400,000,000 2,400,000,000 2,400,000,000 240,000,000 240,000,000 240,000,000 240,000,000 30,000,000 30,300,000 30,603,000 30,909.030 425,000,000 425,000,000 425,000,000 425,000,000 1,705,000,000 1,704,700,000 1,704,397,000 1,704,090,970 358,050,000 357,987,000 357,923,370 357,859,104 1,346,950,000 1,346,713,000 1,346,473,630 1,346,231,866 425,000,000 425,000,000 425,000,000 425,000,000 (10,000,000,000) 50,000,000 120,000,000 120,000,000 120,000,000 120,000,000 50,000,000 70,000,000 (10,050,000,000) 1,701,950,000 1,771,713,000 1,771,473,630 1,771,231,866 (326,392,883) 910,218,929 583,826,046 12/31/26 12/31/27 12/31/28 12/31/29 12/31/30 12/31/31 2,400,000,000 2,400,000,000 2,400,000,000 2,400,000,000 2,400,000,000 2,400,000,000 240,000,000 240,000,000 240,000,000 240,000,000 240,000,000 240,000,000 31,218,120 31,530,302 31,845,605 32,164,061 32,485,701 32,810,558 425,000,000 1,425,000,000 1,425,000,000 1,425,000,000 1,425,000,000 1,425,000,000 1,703,781,880 703,469,698 703,154,395 702,835,939 702,514,299 702,189,442 357,794,195 147,728,637 147,662,423 147,595,547 147,528,003 147,459,783 1,345,987,685 555,741,062 555,491,972 555,240,392 554,986,296 554,729,659 425,000,000 1,425,000,000 1,425,000,000 1,425,000,000 1,425,000,000 1,425,000,000 (3,815,000,000) - 3,182,500,000 120,000,000 120,000,000 120,000,000 120,000,000 120,000,000 (120,000,000) (2,044,012,315) 1,980,741,062 1,980,491,972 1,980,240,392 1,979,986,296 5,282,229,659 Vestas is concerned about the higher interest rate (8%) that NC Bank charges on the blades loan. In comparison, the turbine loan is less expensive (7%). Given that NC Bank encourages voluntary loan principal repayments, with a 3% penalty, you want to investigate the possibility of repaying the blades loan principal as early as possible. Starting from the provided APV model, proceed as follows: A) Early repayment of blades loan (in "Financing") Insert a new independent variable that corresponds to the percentage of annual operating FCF that will be used to repay the loan principal, each year. You may consider starting at 10% of annual operating FCF to be used to repay the loan principal. Insert a new independent variable that corresponds to the annual penalty rate (3%) that NC Bank will charge on annual principal prepayments. Update the annual Financing Flows model for Blades loan so that it accounts for the two new independent variables. B) Recommend a repayment plan What % of FCF do you recommend as loan principal repayment so that the project is still profitable? Support your recommendation with a Data Table. Briefly explain in "Recommendation". Value drivers: Financing Turbines Purchase price Amortized loan maturity (years) Loan interest Annual required payments 10,000,000,000 10 7.00% 1,423,775,027 Blades Purchase price Interest only loan maturity (years) Loan interest Percentage of Free Cash Flow Penalty rate Model: DCF using Annual Financing Flows 5,000,000,000 5 8.00% 10.00% 3.00% 12/31/21 10,000,000,000 Turbines Starting principal Interest Interest tax shield Principal repayment Ending principal 12/31/22 12/31/23 12/31/24 12/31/25 12/31/26 12/31/27 12/31/28 12/31/29 12/31/30 10,000,000,000 9,276,224,973 8,501,785,694 7,673,135,665 6,786,480,134 5,837,758,716 4,822,626,799 3,736,435,648 2,574,211,116 700,000,000 649,335,748 595,124,999 537,119,497 475,053,609 408,643,110 337,583,876 261,550,495 180,194,778 147,000,000 136,360,507 124,976,250 112,795,094 99,761,258 85,815,053 70,892,614 54,925,604 37,840,903 723,775,027 774,439,279 828,650,029 886,655,531 948,721,418 1,015,131,917 1,086,191, 151 1,162,224,532 1,243,580,249 9,276,224,973 8,501,785,694 7.673,135,665 6.786,480,134 5.837,758,716 4,822,626,799 3,736,435,648 2,574,211,116 1,330,630,867 (1,276,775,027) (1,287,414,520) (1,298,798,778) (1,310,979,933) (1,324,013,769) (1,337,959,974) (1,352,882,413) (1,368,849,423) (1,385,934,124) 12/31/31 1,330,630,867 93,144,161 19,560,274 1,330,630,867 10,000,000,000 10,000,000,000 681,380.662 Net equipment 1 flows NPV equipment 1 financing (1,404,214,754) 12/31/21 12/31/22 12/31/23 12/31/24 12/31/25 12/31/26 5,000,000,000 Blades Starting principal Interest Interest tax shield Principal Repayment Penalty annually Ending principal 12/31/27 5,000,000,000 400,000,000 84,000,000 (501,452,286) 12/31/28 5,000,000,000 400,000,000 84,000,000 (541,568,469) 12/31/29 5,000,000,000 400,000,000 84,000,000 (584,893,946) 12/31/30 5,000,000,000 400,000,000 84,000,000 (631,685,462) 12/31/31 5,000,000,000 400,000,000 84,000,000 (11,476,845,286) 5,000,000,000 5,000,000,000 5,000,000,000 (316,000,000) 5,000,000,000 (316,000,000) 5,000,000,000 (316,000,000) 5,000,000,000 (316,000,000) 5,000,000,000 (5,316,000,000) Net equipment 1 flows NPV equipment 1 financing 228,838,268 value drivers: Operations Fixed cost (annual) Fixed cost annual increase Energy generated (MW/H per year) Sale price (per kW/H) Cost of operation (% of sales) ONWC (2021) ONWC requirement (% of sales) Income tax rate WACC Cost of equity 30,000,000 1.00% 15,000,000 0.16 10.00% 50,000,000 5.00% 21.00% 10.00% 11.00% Model: Unlevered Operating FCFs Table 2 - Time line Contractual Sales Variable costs Fixed costs Depreciation EBIT taxes Net operating Income Depreciation Capital Expenditure ONWC Change in ONWC FCF NPV of Operating NPV of Financing APV 12/31/21 12/31/22 12/31/23 12/31/24 12/31/25 2,400,000,000 2,400,000,000 2,400,000,000 2,400,000,000 240,000,000 240,000,000 240,000,000 240,000,000 30,000,000 30,300,000 30,603,000 30,909.030 425,000,000 425,000,000 425,000,000 425,000,000 1,705,000,000 1,704,700,000 1,704,397,000 1,704,090,970 358,050,000 357,987,000 357,923,370 357,859,104 1,346,950,000 1,346,713,000 1,346,473,630 1,346,231,866 425,000,000 425,000,000 425,000,000 425,000,000 (10,000,000,000) 50,000,000 120,000,000 120,000,000 120,000,000 120,000,000 50,000,000 70,000,000 (10,050,000,000) 1,701,950,000 1,771,713,000 1,771,473,630 1,771,231,866 (326,392,883) 910,218,929 583,826,046 12/31/26 12/31/27 12/31/28 12/31/29 12/31/30 12/31/31 2,400,000,000 2,400,000,000 2,400,000,000 2,400,000,000 2,400,000,000 2,400,000,000 240,000,000 240,000,000 240,000,000 240,000,000 240,000,000 240,000,000 31,218,120 31,530,302 31,845,605 32,164,061 32,485,701 32,810,558 425,000,000 1,425,000,000 1,425,000,000 1,425,000,000 1,425,000,000 1,425,000,000 1,703,781,880 703,469,698 703,154,395 702,835,939 702,514,299 702,189,442 357,794,195 147,728,637 147,662,423 147,595,547 147,528,003 147,459,783 1,345,987,685 555,741,062 555,491,972 555,240,392 554,986,296 554,729,659 425,000,000 1,425,000,000 1,425,000,000 1,425,000,000 1,425,000,000 1,425,000,000 (3,815,000,000) - 3,182,500,000 120,000,000 120,000,000 120,000,000 120,000,000 120,000,000 (120,000,000) (2,044,012,315) 1,980,741,062 1,980,491,972 1,980,240,392 1,979,986,296 5,282,229,659Step by Step Solution
There are 3 Steps involved in it
Step: 1

Get Instant Access to Expert-Tailored Solutions
See step-by-step solutions with expert insights and AI powered tools for academic success
Step: 2

Step: 3

Ace Your Homework with AI
Get the answers you need in no time with our AI-driven, step-by-step assistance
Get Started


