Answered step by step
Verified Expert Solution
Question
1 Approved Answer
I've attempted all of these, several different ways, over the course of hours. I really want to learn, so if possible please include a short


I've attempted all of these, several different ways, over the course of hours. I really want to learn, so if possible please include a short description of why you're using what you're using, not just the answer. Also, please note for problem 2 the solution has to avoid if else statements. ***THIS IS PYTHON***
Thank you in advance.
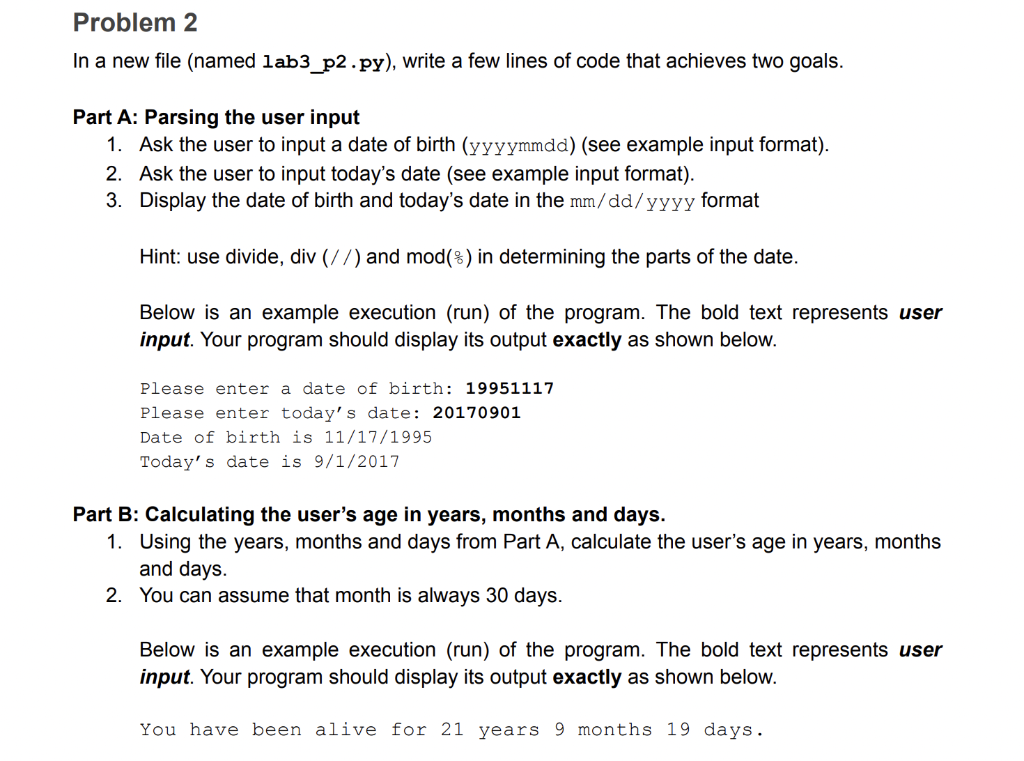
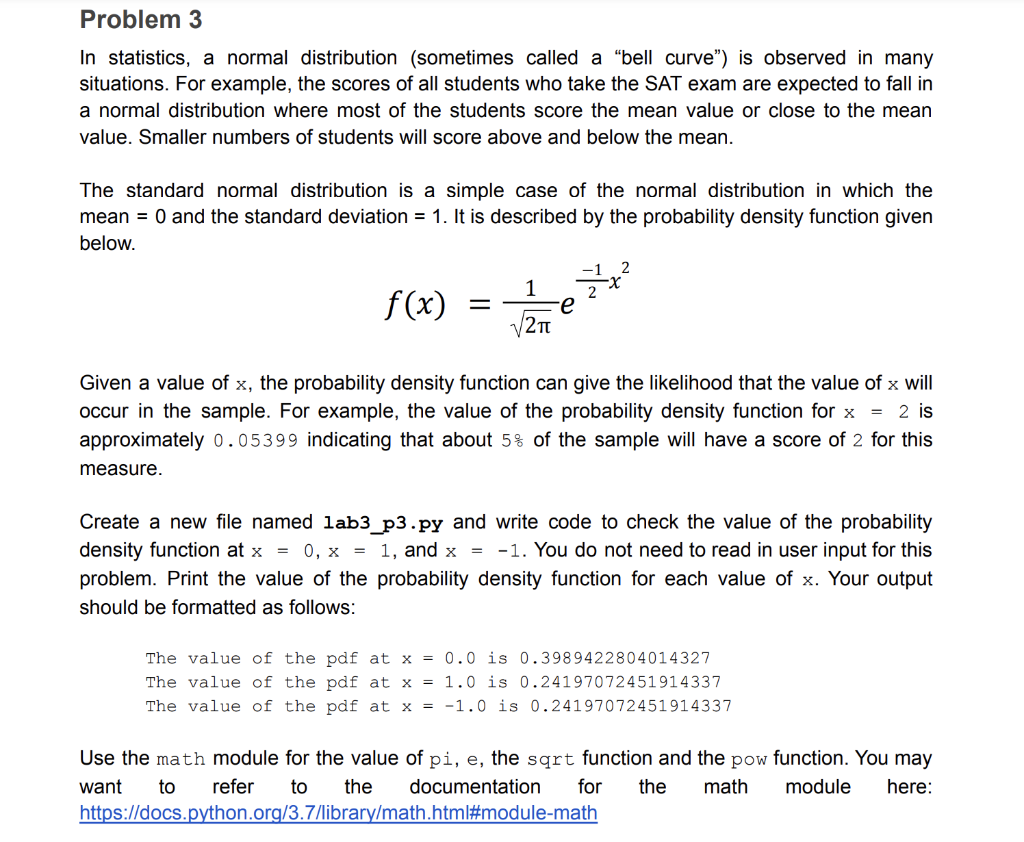
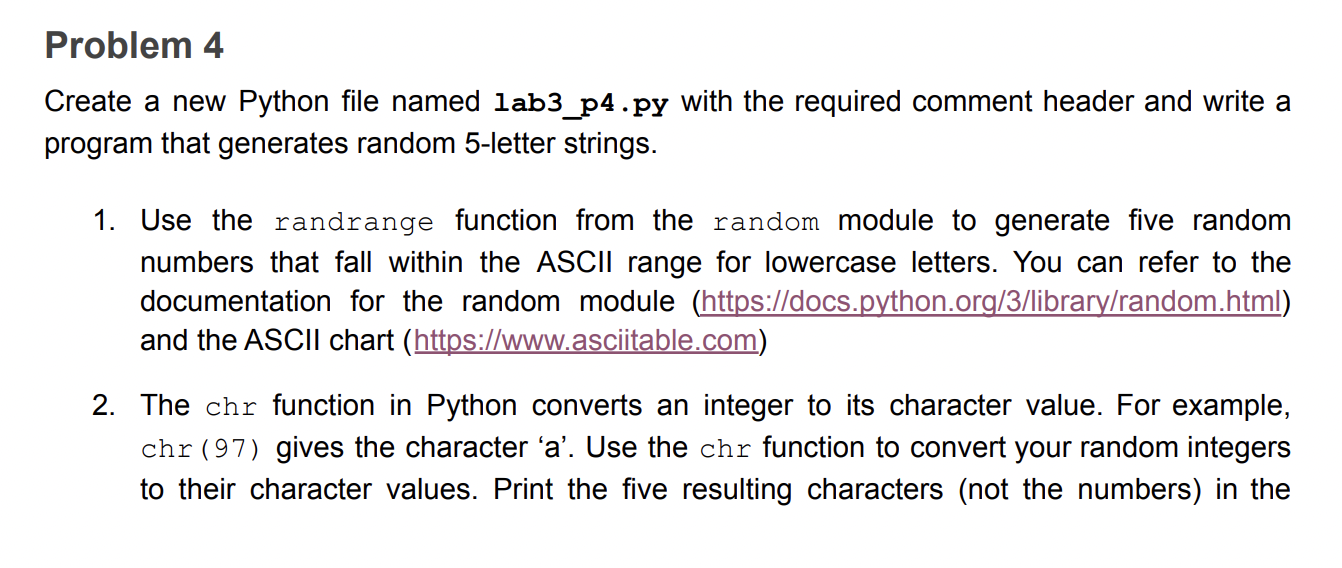
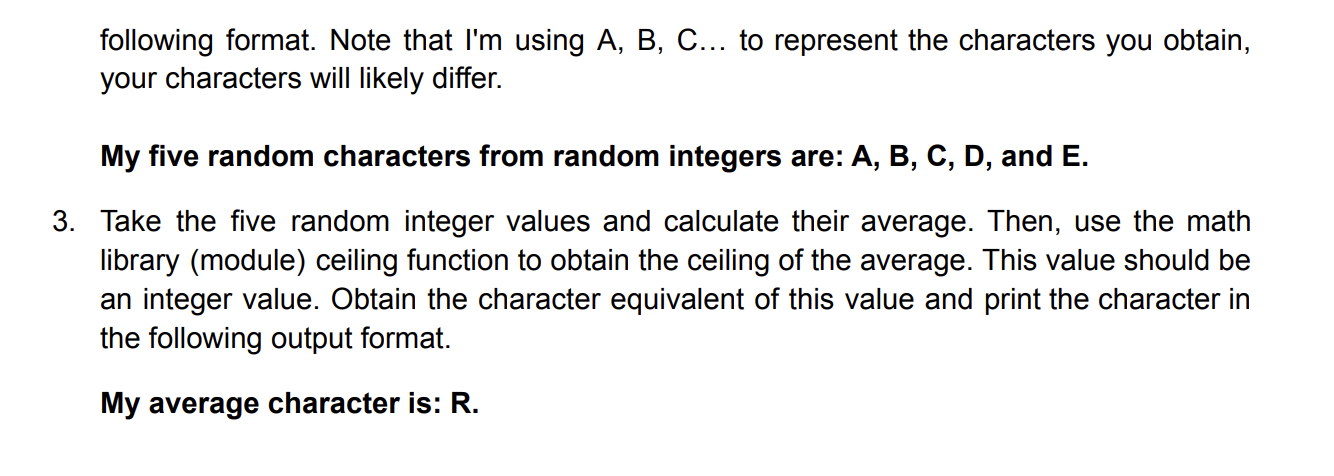
Problem 2 In a new file (named lab3_p2.py), write a few lines of code that achieves two goals. Part A: Parsing the user input 1. Ask the user to input a date of birth (yyyymmdd) (see example input format). 2. Ask the user to input today's date (see example input format). 3. Display the date of birth and today's date in the mm/dd/ yyyy format Hint: use divide, div(//) and mod() in determining the parts of the date. Below is an example execution (run) of the program. The bold text represents user input. Your program should display its output exactly as shown below. Please enter a date of birth: 19951117 Please enter today's date: 20170901 Date of birth is 11/17/1995 Today's date is 9/1/2017 Part B: Calculating the user's age in years, months and days. 1. Using the years, months and days from Part A, calculate the user's age in years, months and days. 2. You can assume that month is always 30 days. Below is an example execution (run) of the program. The bold text represents user input. Your program should display its output exactly as shown below. You have been alive for 21 years 9 months 19 days. In statistics, a normal distribution (sometimes called a "bell curve") is observed in many situations. For example, the scores of all students who take the SAT exam are expected to fall in a normal distribution where most of the students score the mean value or close to the mean value. Smaller numbers of students will score above and below the mean. The standard normal distribution is a simple case of the normal distribution in which the mean =0 and the standard deviation =1. It is described by the probability density function given below. f(x)=21e21x2 Given a value of x, the probability density function can give the likelihood that the value of x will occur in the sample. For example, the value of the probability density function for x=2 is approximately 0.05399 indicating that about 5% of the sample will have a score of 2 for this measure. Create a new file named lab3_p3.py and write code to check the value of the probability density function at x=0,x=1, and x=1. You do not need to read in user input for this problem. Print the value of the probability density function for each value of x. Your output should be formatted as follows: The value of the pdf at x=0.0 is 0.3989422804014327 The value of the pdf at x=1.0 is 0.24197072451914337 The value of the pdf at x=1.0 is 0.24197072451914337 Use the math module for the value of pi, e, the sqrt function and the pow function. You may want to refer to the documentation for the math module here: https://docs.python.org/3.7/library/math.html\#module-math Create a new Python file named lab3_p4.py with the required comment header and write a program that generates random 5-letter strings. 1. Use the randrange function from the random module to generate five random numbers that fall within the ASCIl range for lowercase letters. You can refer to the documentation for the random module (https://docs.python.org/3/library/random.html) and the ASCII chart (https://www.asciitable.com) 2. The chr function in Python converts an integer to its character value. For example, chr (97) gives the character ' a '. Use the chr function to convert your random integers to their character values. Print the five resulting characters (not the numbers) in the following format. Note that I'm using A,B,C to represent the characters you obtain, your characters will likely differ. My five random characters from random integers are: A,B,C,D, and E. Take the five random integer values and calculate their average. Then, use the math library (module) ceiling function to obtain the ceiling of the average. This value should be an integer value. Obtain the character equivalent of this value and print the character in the following output format. My average character is: RStep by Step Solution
There are 3 Steps involved in it
Step: 1

Get Instant Access to Expert-Tailored Solutions
See step-by-step solutions with expert insights and AI powered tools for academic success
Step: 2

Step: 3

Ace Your Homework with AI
Get the answers you need in no time with our AI-driven, step-by-step assistance
Get Started


