I've done the excel work and i need help answering the questions. here are the excel a. Plot the series. What can you learn from
I've done the excel work and i need help answering the questions. here are the excel
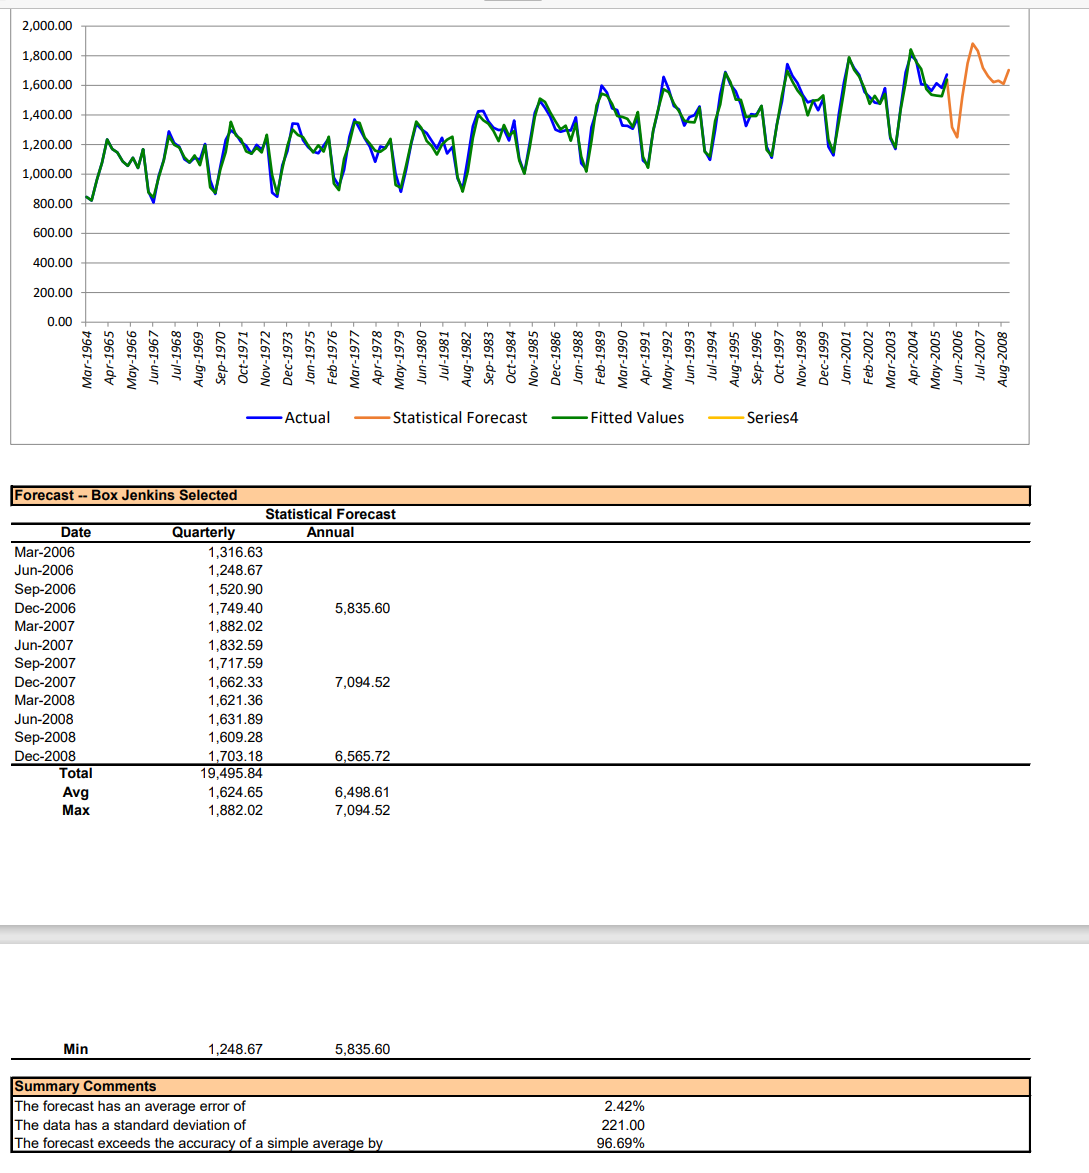
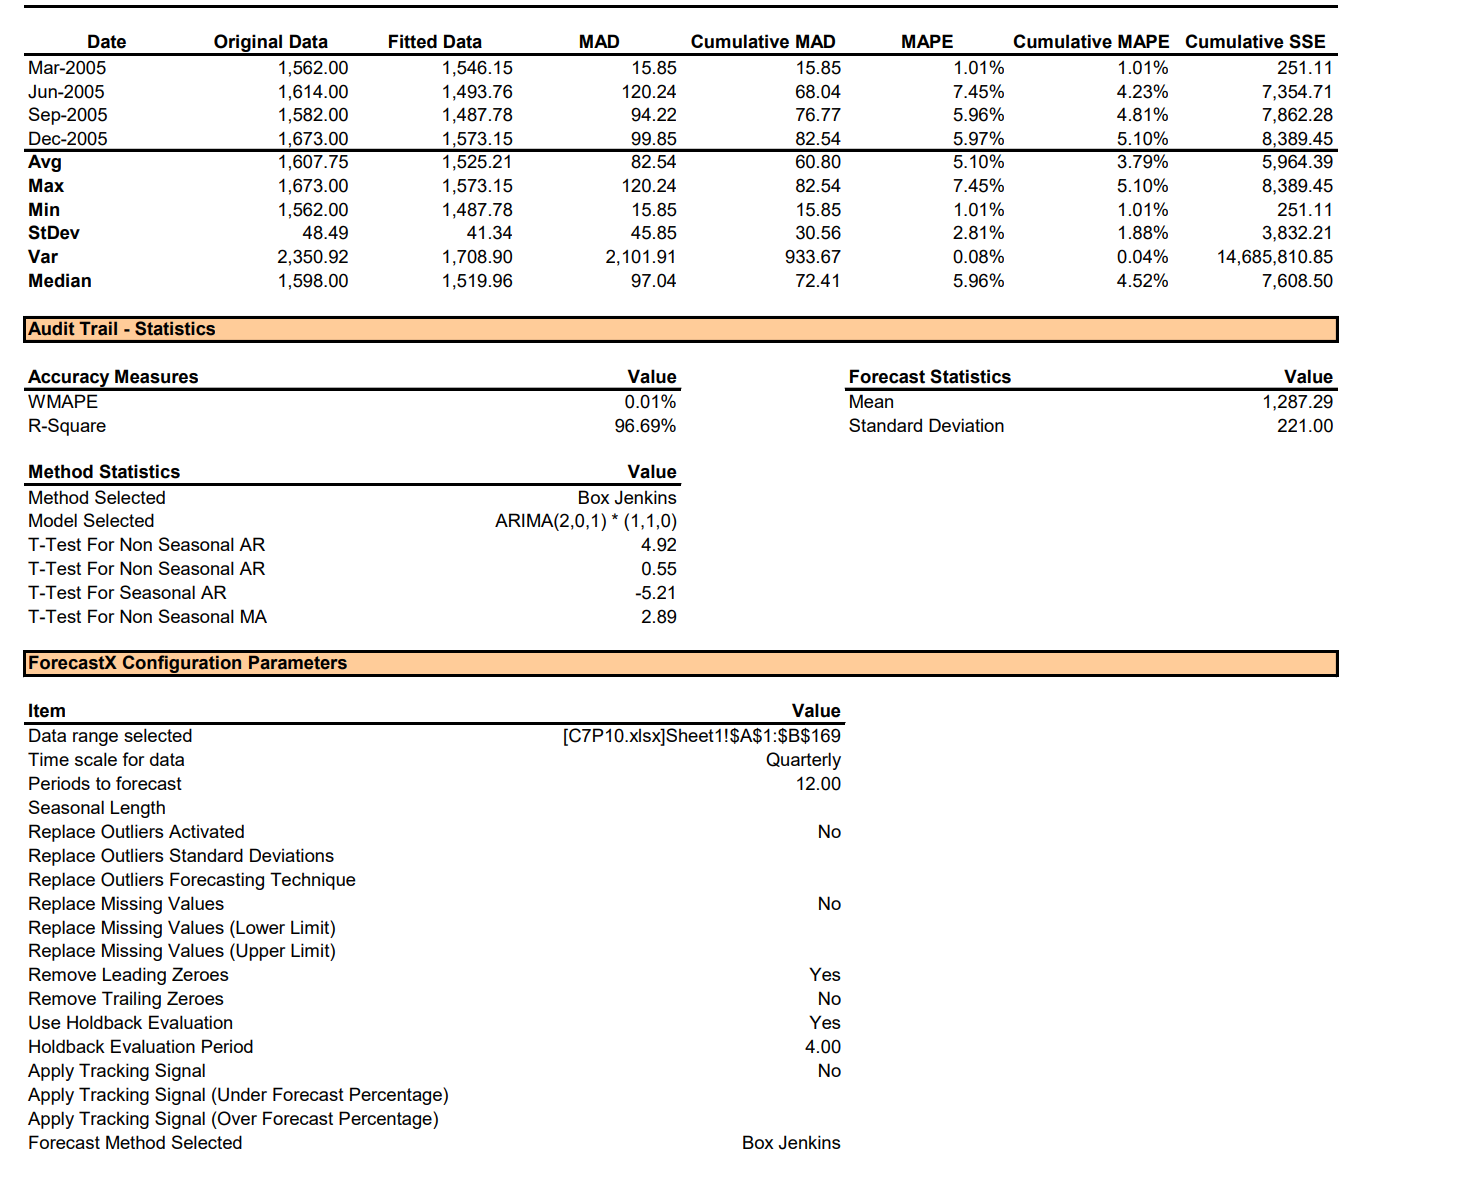
a. Plot the series. What can you learn from examining this plot? b. Calculate and display the first 24 autocorrelations for the series. What do the ACF and PACF suggest about the series? c. Suggest a possible set of differencing to use with the series. d. Estimate an ARIMA model that you believe to be a good candidate for forecasting future retail sales at hardware stores. Test the Ljung-Box statistic and report your findings. Finally, plot the first 24 autocorrelations of the residuals to your best model.2,000.00 1,800.00 1,600.00 1,400.00 1,200.00 1,000.00 800.00 600.00 400.00 200.00 0.00 Oct-1971 Jun-1967 Jul-1968 Jan-2001 Jun-2006- Feb-2002 Mar-1964 Aug-1969 Apr-1965 Apr-2004 Jul-2007 May-1966 Mar-2003- Sep-1970 Aug-2008 May-2005 - Actual Statistical Forecast Fitted Values Series4 Forecast -- Box Jenkins Selected Statistical Forecast Date Quarterly Annual Mar-2006 ,316.63 Jun-2006 1,248.67 Sep-2006 1,520.90 Dec-2006 1,749.40 5,835.60 Mar-2007 1,882.02 Jun-2007 1,832.59 Sep-2007 1,717.59 Dec-2007 1,662.33 7,094.52 Mar-2008 1,621.36 Jun-2008 1,631.89 Sep-2008 ,609.28 Dec-2008 1,703.18 6,565.72 Total 9,495.84 Avg 1,624.65 6,498.61 Max 1,882.02 7,094.52 Min 1,248.67 5,835.60 Summary Comments The forecast has an average error of 2.42% The data has a standard deviation of 221.00 The forecast exceeds the accuracy of a simple average by 96.69%Date al Data Fitted Data MAD Cumulative MAD MAPE Cumulative MAPE Cumulative SSE Mar-2005 1,562.00 1,546.15 15.85 15.85 1.019% 1.01% 251.11 Jun-2005 1,614.00 1,493.76 120.24 68.04 7.45% 4.23% 7,354.71 Sep-2005 1,582.00 1,487.78 94.22 76.77 5.96% 4.81% 7,862.28 Dec-2005 1,673.00 1,573.15 99.85 32.54 5.97% 5.10% 8,389.45 Avg ,607.75 1,525.21 32.54 0.80 5.10% 3.79% 6,964.39 Max 1,673.00 1,573.15 120.24 32.54 7.45% 5.10% 8,389.45 Min 1,562.00 1,487.78 15.85 15.85 1.01% 1.01% 251.11 StDev 48.49 41.34 45.85 30.56 2.81% 1.88% 3,832.21 Var 2,350.92 1,708.90 2, 101.91 933.67 0.08% 0.04% 14,685,810.85 Median 1,598.00 1,519.96 97.04 72.41 5.96% 4.52% 7,608.50 Audit Trail - Statistics Accuracy Measures Value Forecast Statistics Value WMAPE 0.01% Mean ,287.29 R-Square 96.69% Standard Deviation 221.00 Method Statistics Value Method Selected Box Jenkins Model Selected ARIMA(2,0,1) * (1, 1,0) T-Test For Non Seasonal AR 4.92 T-Test For Non Seasonal AR 0.55 T-Test For Seasonal AR 5.21 T-Test For Non Seasonal MA 2.89 ForecastX Configuration Parameters Item Value Data range selected C7P10.xlsx]Sheet1!$A$1:$B$169 Time scale for data Quarterly Periods to forecast 12.00 Seasonal Length Replace Outliers Activated No Replace Outliers Standard Deviations Replace Outliers Forecasting Technique Replace Missing Values No Replace Missing Values (Lower Limit) Replace Missing Values (Upper Limit) Remove Leading Zeroes Yes Remove Trailing Zeroes No Use Holdback Evaluation Yes Holdback Evaluation Period 4.00 Apply Tracking Signal No Apply Tracking Signal (Under Forecast Percentage) Apply Tracking Signal (Over Forecast Percentage) Forecast Method Selected Box Jenkins
Step by Step Solution
There are 3 Steps involved in it
Step: 1
Get Instant Access to Expert-Tailored Solutions
See step-by-step solutions with expert insights and AI powered tools for academic success
Step: 2
Step: 3
Ace Your Homework with AI
Get the answers you need in no time with our AI-driven, step-by-step assistance