Answered step by step
Verified Expert Solution
Link Copied!

Question

1 Approved Answer

j) Does the mean calculated in (h) come from a sampling distribution that is approximately Normal? Check all three conditions of the Central Limit Theorem
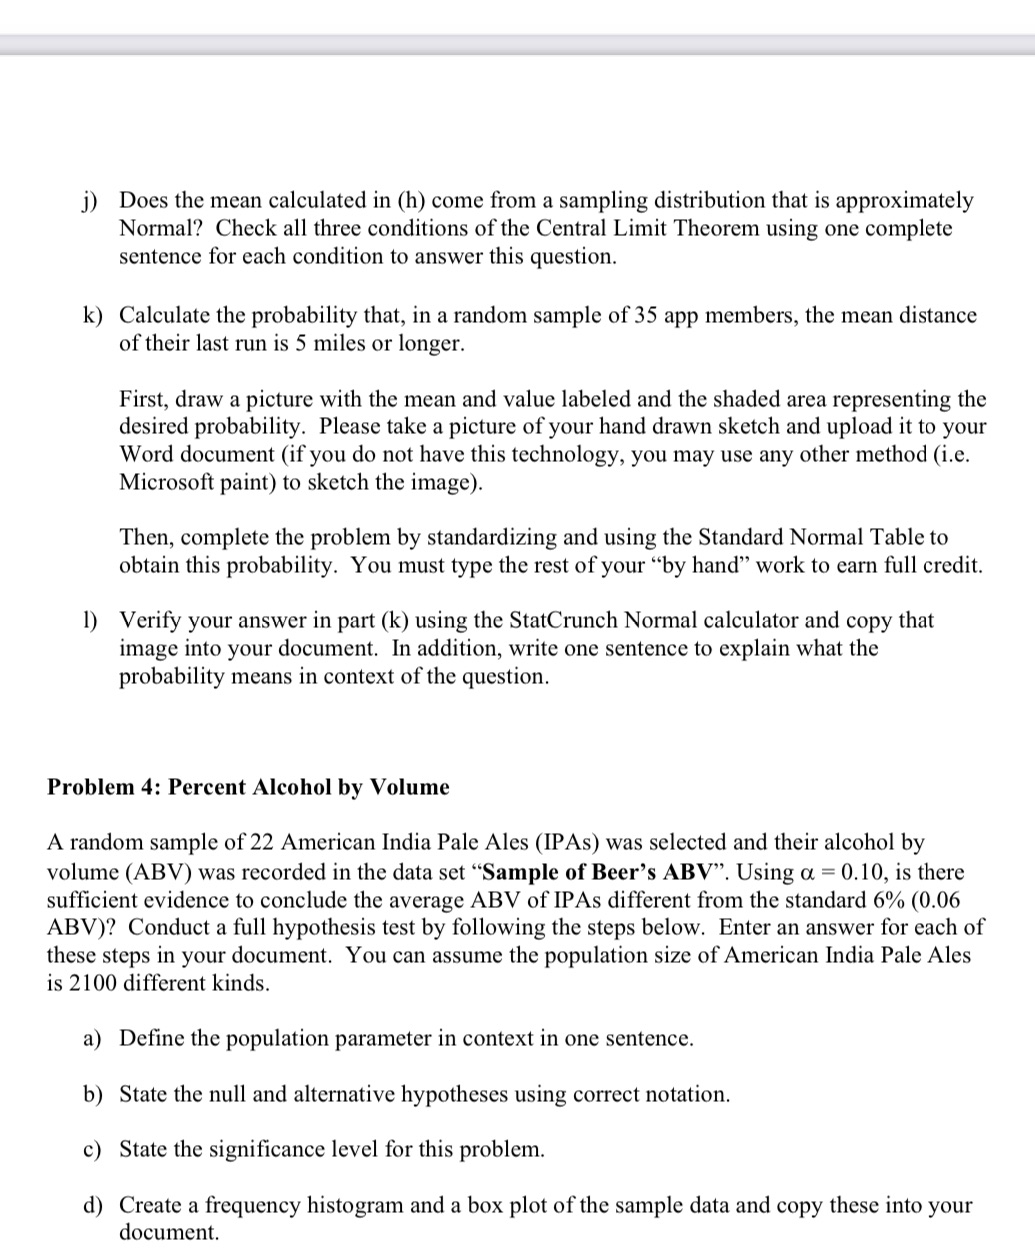
image text in transcribed
j) Does the mean calculated in (h) come from a sampling distribution that is approximately Normal? Check all three conditions of the Central Limit Theorem using one complete sentence for each condition to answer this question. k) Calculate the probability that, in a random sample of 35 app members, the mean distance of their last run is 5 miles or longer. First, draw a picture with the mean and value labeled and the shaded area representing the desired probability. Please take a picture of your hand drawn sketch and upload it to your Word document (if you do not have this technology, you may use any other method (i.e. Microsoft paint) to sketch the image). Then, complete the problem by standardizing and using the Standard Normal Table to obtain this probability. You must type the rest of your \"by hand\" work to earn full credit. 1) Verify your answer in part (k) using the StatCrunch Normal calculator and copy that image into your document. In addition, write one sentence to explain what the probability means in context of the question. Problem 4: Percent Alcohol by Volume A random sample of 22 American India Pale Ales (IPAs) was selected and their alcohol by volume (ABV) was recorded in the data set \"Sample of Beer's ABV\". Using 0. = 0.10, is there sufficient evidence to conclude the average ABV of [PAS different from the standard 6% (0.06 ABV)? Conduct a full hypothesis test by following the steps below. Enter an answer for each of these steps in your document. You can assume the population size of American India Pale Ales is 2100 different kinds. a) Dene the population parameter in context in one sentence. b) State the null and alternative hypotheses using correct notation. c) State the significance level for this problem. d) Create a frequency histogram and a box plot of the sample data and copy these into your document

Step by Step Solution

There are 3 Steps involved in it

Step: 1

blur-text-image

Get Instant Access to Expert-Tailored Solutions

See step-by-step solutions with expert insights and AI powered tools for academic success

Step: 2

blur-text-image

Step: 3

blur-text-image

Ace Your Homework with AI

Get the answers you need in no time with our AI-driven, step-by-step assistance

Get Started

Recommended Textbook for

Precalculus Enhanced With Graphing Utilities (Subscription)

Authors: Michael, Michael Sullivan III, Michael III Sullivan, III Sullivan

6th Edition

0321849108, 9780321849106

More Books

Students also viewed these Mathematics questions

Question

Evaluate 3x - x for x = -2 Answer:

Answered: 1 week ago

Question

Discuss consumer-driven health plans.

Answered: 1 week ago