

Answered step by step
Verified Expert Solution
Question
1 Approved Answer
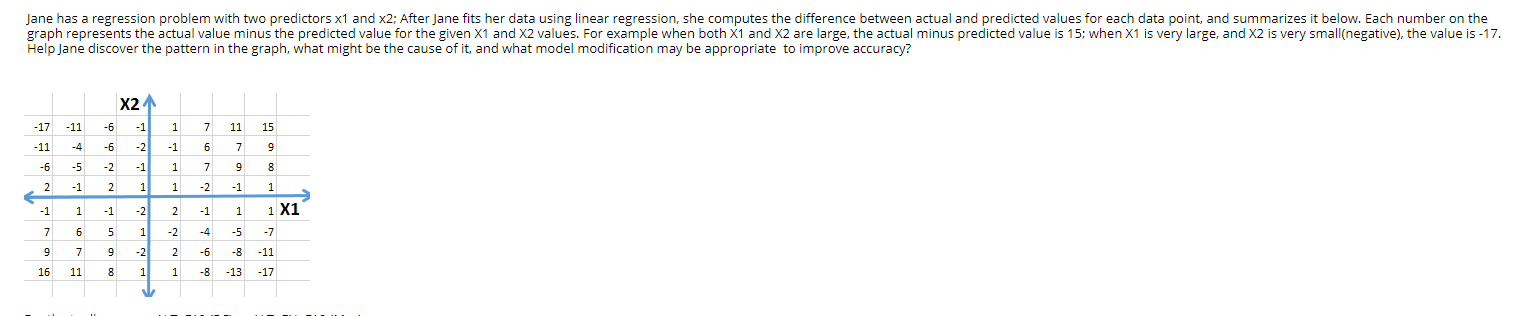
Jane has a regression problem with two predictors x1 and 2: After Jane fits her data using linear regression, she computes the difference between actual
Step by Step Solution
There are 3 Steps involved in it
Step: 1

Get Instant Access to Expert-Tailored Solutions
See step-by-step solutions with expert insights and AI powered tools for academic success
Step: 2

Step: 3
Ace Your Homework with AI
Get the answers you need in no time with our AI-driven, step-by-step assistance
Get Started
Microsoft Visual Basic 2017 For Windows Web And Database Applications
Authors: Corinne Hoisington
1st Edition
1337102113, 978-1337102117