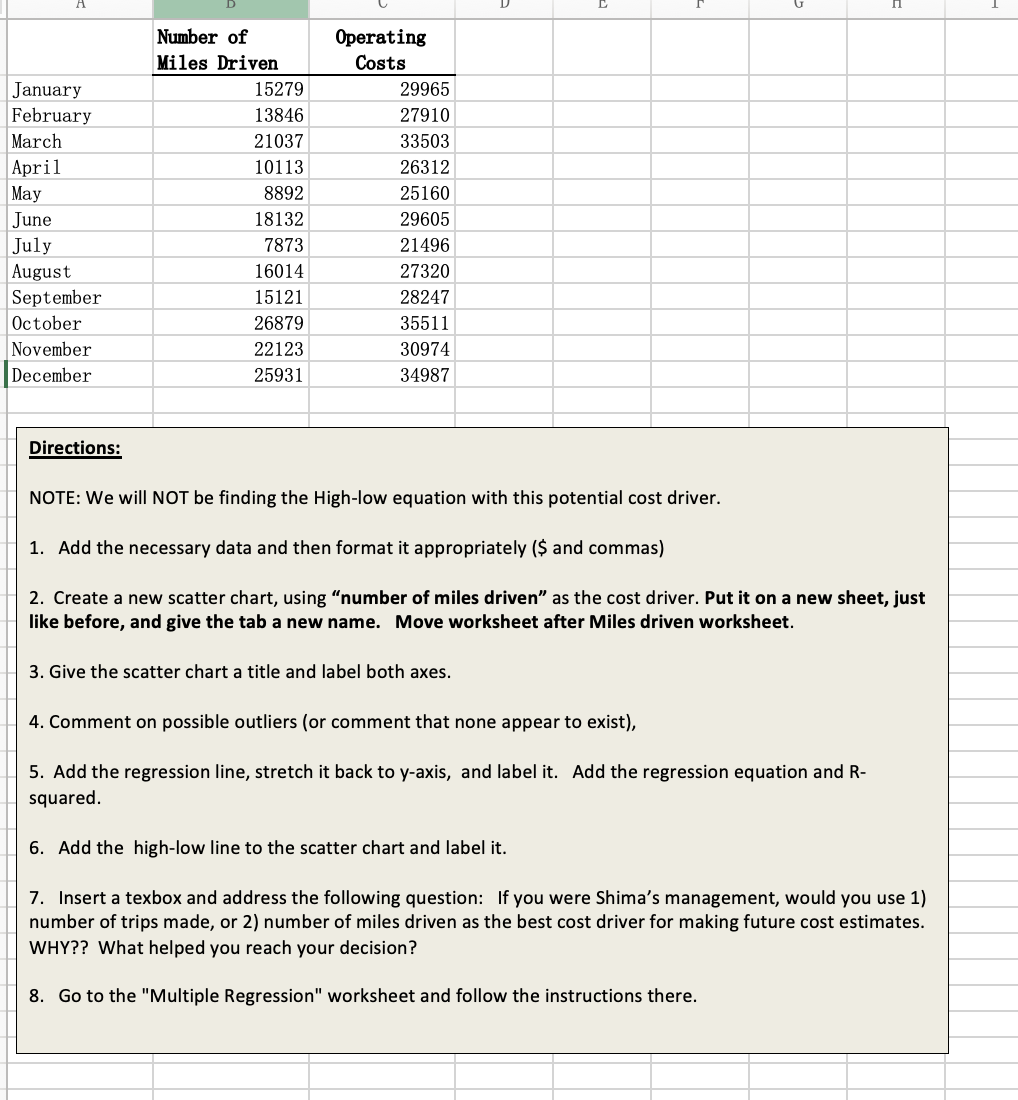
January February March April May June July August September October November December Number of Miles Driven 15279 13846 21037 10113 8892 18132 7873 16014 15121 26879 22123 25931 Operating Costs 29965 27910 33503 26312 25160 29605 21496 27320 28247 35511 30974 34987 Directions: NOTE: We will NOT be finding the High-low equation with this potential cost driver. 1. Add the necessary data and then format it appropriately ($ and commas) 2. Create a new scatter chart, using "number of miles driven" as the cost driver. Put it on a new sheet, just like before, and give the tab a new name. Move worksheet after Miles driven worksheet. 3. Give the scatter chart a title and label both axes. 4. Comment on possible outliers (or comment that none appear to exist), 5. Add the regression line, stretch it back to y-axis, and label it. Add the regression equation and R- squared. 6. Add the high-low line to the scatter chart and label it. 7. Insert a texbox and address the following question: If you were Shima's management, would you use 1) number of trips made, or 2) number of miles driven as the best cost driver for making future cost estimates. WHY?? What helped you reach your decision? 8. Go to the "Multiple Regression" worksheet and follow the instructions there. January February March April May June July August September October November December Number of Miles Driven 15279 13846 21037 10113 8892 18132 7873 16014 15121 26879 22123 25931 Operating Costs 29965 27910 33503 26312 25160 29605 21496 27320 28247 35511 30974 34987 Directions: NOTE: We will NOT be finding the High-low equation with this potential cost driver. 1. Add the necessary data and then format it appropriately ($ and commas) 2. Create a new scatter chart, using "number of miles driven" as the cost driver. Put it on a new sheet, just like before, and give the tab a new name. Move worksheet after Miles driven worksheet. 3. Give the scatter chart a title and label both axes. 4. Comment on possible outliers (or comment that none appear to exist), 5. Add the regression line, stretch it back to y-axis, and label it. Add the regression equation and R- squared. 6. Add the high-low line to the scatter chart and label it. 7. Insert a texbox and address the following question: If you were Shima's management, would you use 1) number of trips made, or 2) number of miles driven as the best cost driver for making future cost estimates. WHY?? What helped you reach your decision? 8. Go to the "Multiple Regression" worksheet and follow the instructions there


