

Question
January Products,Price (TL),In-store purchases (Kg),Online purchases (Kg) A,15,20,35 B,20,15,42 C,25,18,38 D,35,10,33 E,25,29,40 F,30,26,39 G,50,10,29 H,30,16,34 J,50,19,43 K,20,25,50 L,30,21,57 M,35,24,28 February Products,Price (TL),In-store purchases (Kg),Online purchases
January
Products,Price (TL),In-store purchases (Kg),Online purchases (Kg)
A,15,20,35
B,20,15,42
C,25,18,38
D,35,10,33
E,25,29,40
F,30,26,39
G,50,10,29
H,30,16,34
J,50,19,43
K,20,25,50
L,30,21,57
M,35,24,28
February
| Products,Price (TL),In-store purchases (Kg),Online purchases (Kg) |
| A,15,14,38 |
| B,20,12,47 |
| C,25,17,52 |
| D,35,22,41 |
| E,25,18,44 |
| F,30,13,38 |
| G,50,13,46 |
| H,30,25,43 |
| J,50,16,44 |
| K,20,25,36 |
| L,30,24,36 |
| M,35,19,34 |
March
| Products,Price (TL),In-store purchases (Kg),Online purchases (Kg) |
| A,15,27,58 |
| B,20,10,45 |
| C,25,24,51 |
| D,35,27,28 |
| E,25,21,35 |
| F,30,16,45 |
| G,50,15,54 |
| H,30,23,50 |
| J,50,25,26 |
| K,20,20,34 |
| L,30,19,38 |
| M,35,26,33 |
These three months are sufficent for the program.
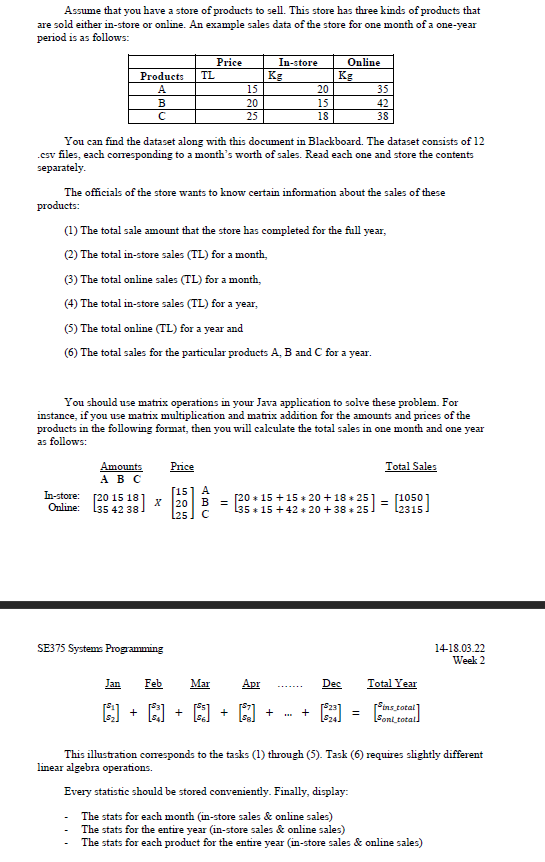
a Assume that you have a store of products to sell. This store has three kinds of products that are sold either in-store or online. An example sales data of the store for one month of a one-year period is as follows: Products B Price TL 15 20 25 In-store Kg 20 15 18 Online Kg 35 42 38 You can find the dataset along with this document in Blackboard. The dataset consists of 12 .csv files, each corresponding to a month's worth of sales. Read each one and store the contents separately. The officials of the store wants to know certain information about the sales of these products: (1) The total sale amount that the store has completed for the full year, (2) The total in-store sales (TL) for a month, (3) The total online sales (TL) for a month, (4) The total in-store sales (TL) for a year, (5) The total online (TL) for a year and (6) The total sales for the particular products A, B and C for a year. You should use matrix operations in your Java application to solve these problem. For instance, if you use matrix multiplication and matrix addition for the amounts and prices of the products in the following format, then you will calculate the total sales in one month and one year as follows: Price Total Sales Amounts ABC In-store: 520 15 18 Online: L35 42 38 [15] A x 20 B L25] C [20+15+15+20 +18+25] L35 * 15 +42 +20 + 38 * 25 = 11050 12315 SE375 Systems Programming 14-18.03.22 Week 2 Jan Feb Mar Apr Dec Total Year () + + + + total son total) This illustration corresponds to the tasks (1) through (5). Task (6) requires slightly different linear algebra operations. Every statistic should be stored conveniently. Finally, display: The stats for each month (in-store sales & online sales) The stats for the entire year (in-store sales & online sales) The stats for each product for the entire year (in-store sales & online sales) a Assume that you have a store of products to sell. This store has three kinds of products that are sold either in-store or online. An example sales data of the store for one month of a one-year period is as follows: Products B Price TL 15 20 25 In-store Kg 20 15 18 Online Kg 35 42 38 You can find the dataset along with this document in Blackboard. The dataset consists of 12 .csv files, each corresponding to a month's worth of sales. Read each one and store the contents separately. The officials of the store wants to know certain information about the sales of these products: (1) The total sale amount that the store has completed for the full year, (2) The total in-store sales (TL) for a month, (3) The total online sales (TL) for a month, (4) The total in-store sales (TL) for a year, (5) The total online (TL) for a year and (6) The total sales for the particular products A, B and C for a year. You should use matrix operations in your Java application to solve these problem. For instance, if you use matrix multiplication and matrix addition for the amounts and prices of the products in the following format, then you will calculate the total sales in one month and one year as follows: Price Total Sales Amounts ABC In-store: 520 15 18 Online: L35 42 38 [15] A x 20 B L25] C [20+15+15+20 +18+25] L35 * 15 +42 +20 + 38 * 25 = 11050 12315 SE375 Systems Programming 14-18.03.22 Week 2 Jan Feb Mar Apr Dec Total Year () + + + + total son total) This illustration corresponds to the tasks (1) through (5). Task (6) requires slightly different linear algebra operations. Every statistic should be stored conveniently. Finally, display: The stats for each month (in-store sales & online sales) The stats for the entire year (in-store sales & online sales) The stats for each product for the entire year (in-store sales & online sales)Step by Step Solution
There are 3 Steps involved in it
Step: 1

Get Instant Access to Expert-Tailored Solutions
See step-by-step solutions with expert insights and AI powered tools for academic success
Step: 2

Step: 3
Ace Your Homework with AI
Get the answers you need in no time with our AI-driven, step-by-step assistance
Get Started
Audit Of The Universe Are We Guarding Our Cocooning Atmosphere Watching Over Our Life Giving Water And Fertile Soil Respecting Our Nourishing Flora And Prodigious Fauna Are We Managing Earths Resources For Better Or Worse
Authors: Sam Kneller
1st Edition
B08DBYMT4K, 979-8668249695