Question: (JAVA - DATA STRUCTURES) Hi, THIS IS THE FOURTH TIME I HAVE POSTED THIS QUESTION AND NOBODY WANTS TO HELP ME. PLEASE, I NEED SOMEONE
(JAVA - DATA STRUCTURES)
Hi, THIS IS THE FOURTH TIME I HAVE POSTED THIS QUESTION AND NOBODY WANTS TO HELP ME. PLEASE, I NEED SOMEONE TO HELP ME. I need help with the program CountryDisplayer.java and Country.java. That is all I need. Please, I would highly appreciate if you could just help me. You don't have to do everything, you can just get me started on it pls.
NOTE: HOW CAN I SHARE WITH YOU THE NECESSARY FILES? POST A PICTURE? WHAT ABOUT THE DATA THAT NEEDS TO BE ORGANIZED? PLS, I SERIOUSLY NEED YOUR HELP
SETUP
The code that you write for this assignment will build on top of the List ADT and one of the implementations of List that we've seen in class. The code will also use 1) a library for producing graphs called JFreeChart, 2) one additional class that I provided to make it easy for you to interact with the graphing library, and 3) a dataset containing information about countries, created using data from the World Bank:
- jfreechart-1.5.0.jar
- BarChart.java
- CountryDataset.csv
Afghanistan,0.31647873497721196,18168.86,82.60891342163086,17.011405995013824,0.103138023195208,3.006609490465427,34295325.14285714,3.900860497092041
Oman,16.1347536949426,62201.55080448151,100.0,0.0,2.5718221209005327,5.6534794468626615,4218868.428571428,7.1402588331884544 Qatar,41.0352002847597,103155.12072137301,100.0,0.0,9.636156954527268,4.459003515508291,2531190.1428571427,4.5360120252141645 Maldives,2.83161983745105,NaN,99.86328582763669,0.9983738251675678,1.1327304513667067,4.34349154240501,455767.28571428574,5.446852924580132 Equatorial Guinea,4.840438109455877,6374.17105425022,66.46417236328125,6.6940880271428025,19.267839302429465,4.035397300728738,1169228.857142857,4.988266816913943 Lebanon,3.91594244914353,NaN,99.99894460042317,4.385490965120395,2.5948724159837133,3.9283229231561343,6374323.142857143,4.10827796131811 ... Eritrea,NaN,4977.88803281947,45.26542599995931,80.04016597659202,4.8715939593562325,NaN,NaN,NaN
PROGRAMING STEPS AND TIPS
Step 1: Writing the Country class
I provide the following starter code for the Country class. All you need to do is add the getter and setter for the countryName data field, and finish implementing getFeature, setFeature, and toString.
public class Country { private String countryName; private double co2Emissions; private double totalGreenhouseGasEmissions; private double accessToElectricity; private double renewableEnergy; private double protectedAreas; private double populationGrowth; private double populationTotal; private double urbanPopulationGrowth; public Country(String[] countryData) { countryName = countryData[0]; co2Emissions = Double.parseDouble(countryData[1]); totalGreenhouseGasEmissions = Double.parseDouble(countryData[2]); accessToElectricity = Double.parseDouble(countryData[3]); renewableEnergy = Double.parseDouble(countryData[4]); protectedAreas = Double.parseDouble(countryData[5]); populationGrowth = Double.parseDouble(countryData[6]); populationTotal = Double.parseDouble(countryData[7]); urbanPopulationGrowth = Double.parseDouble(countryData[8]); } // add the getter and setter for countryName here... // return the corresponding value of the given featureName ("CO2Emissions", "TotalGreenhouseGasEmissions", etc.) public double getFeature(String featureName) { return 0; // CHANGE ME } // set the corresponding value of the given featureName as newValue. public void setFeature(String featureName, double newValue) { // IMPLEMENT ME } public String toString() { // IMPLEMENT ME return null; } // Test toString: public static void main (String[] args) { String[] data = {"Country1", "1", "2", "3", "4", "5", "6", "7", "8"}; Country country1 = new Country(data); System.out.println(country1); // Or use one line: Country country2 = new Country(new String[] {"Country2", "9", "8", "NaN", "6", "5", "4", "3", "2"}); System.out.println(country2); } }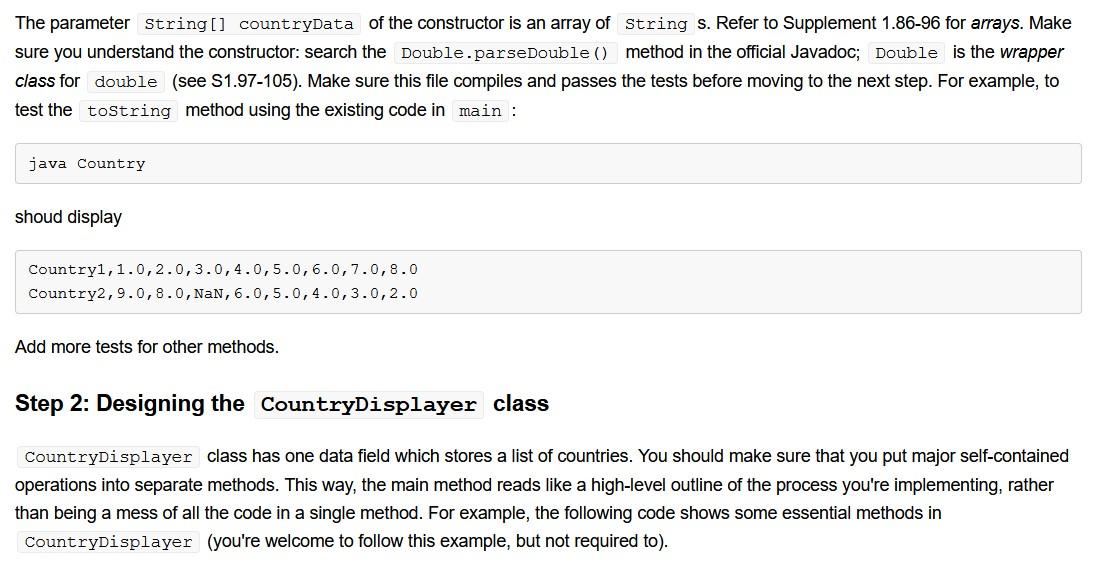
public class CountryDisplayer { private List countries; public CountryDisplayer(String filePath) { // Read the country file and load the countries. } public ?? sortCountryList(??) { // ... } public ?? displayTextCountries(??) { // ... } public ?? displayCountryGraph(??) { // ... } public static void main(String[] args) { // If there's no command-line argument, print a usage statement // and exit. Otherwise, use args[0] as the input file path. if (args.length == 0) { // ... } //Call the methods you defined above to load, process, and display the countries } }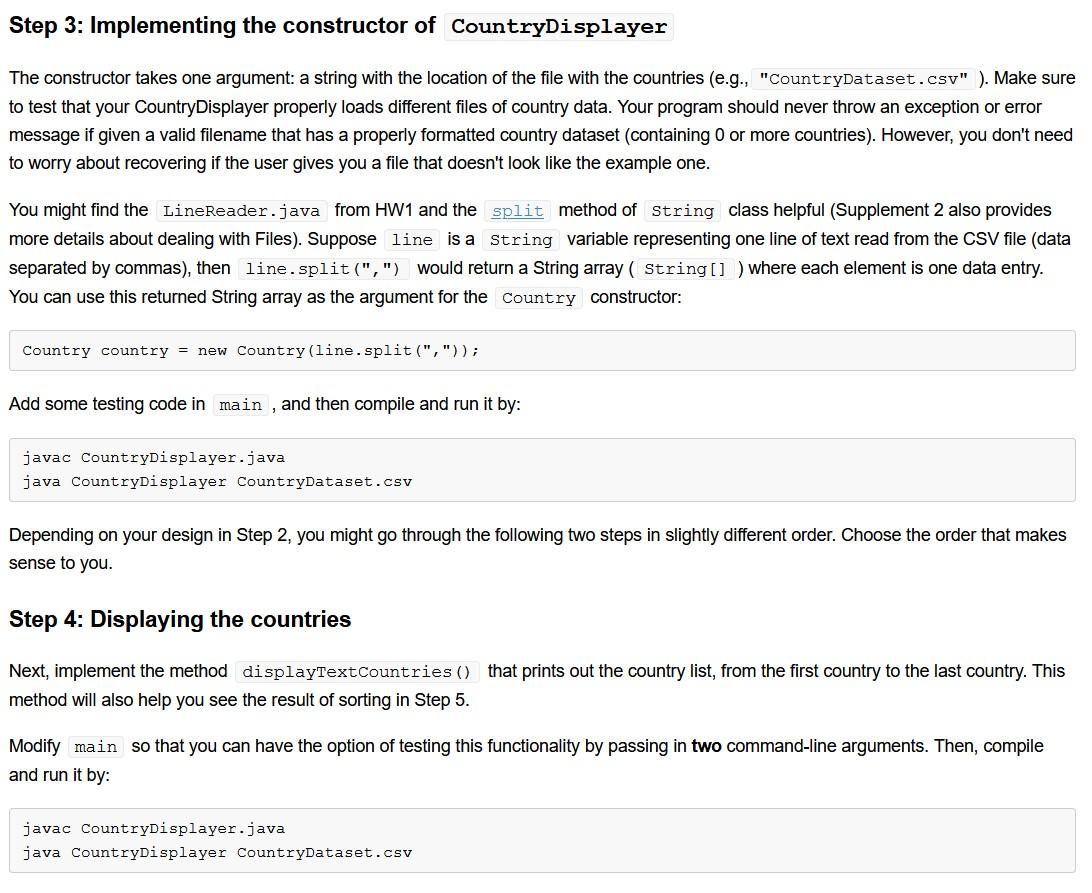
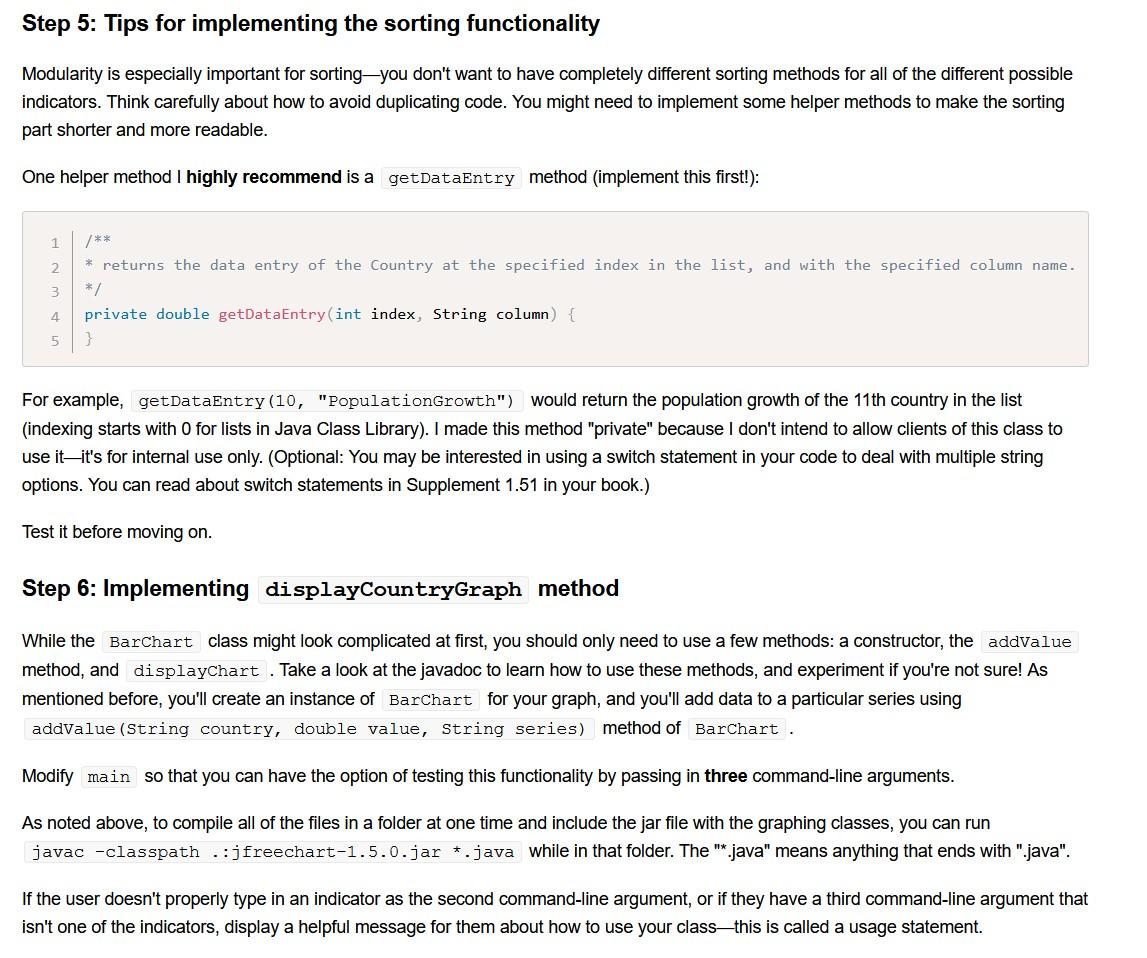
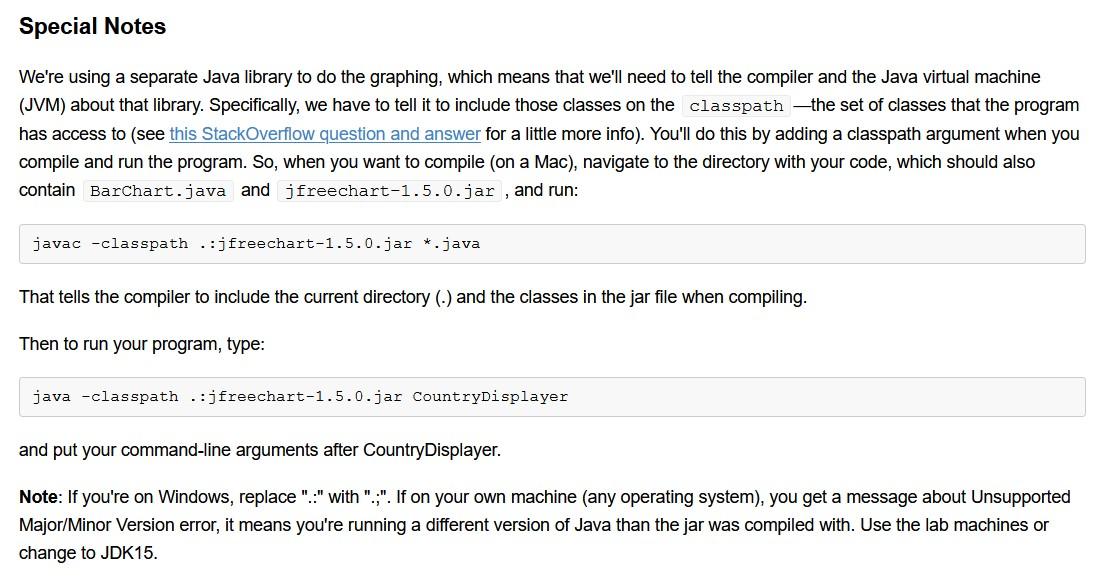
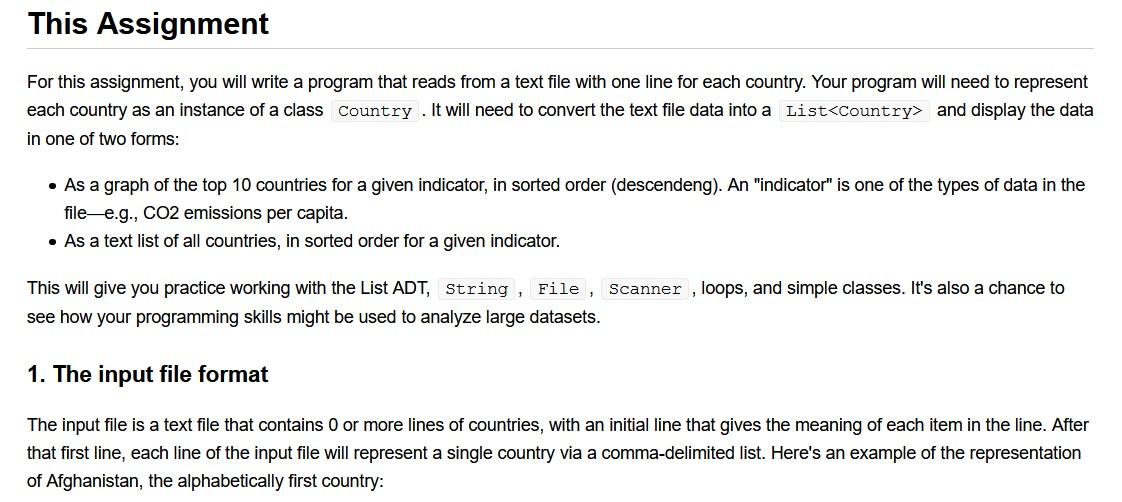
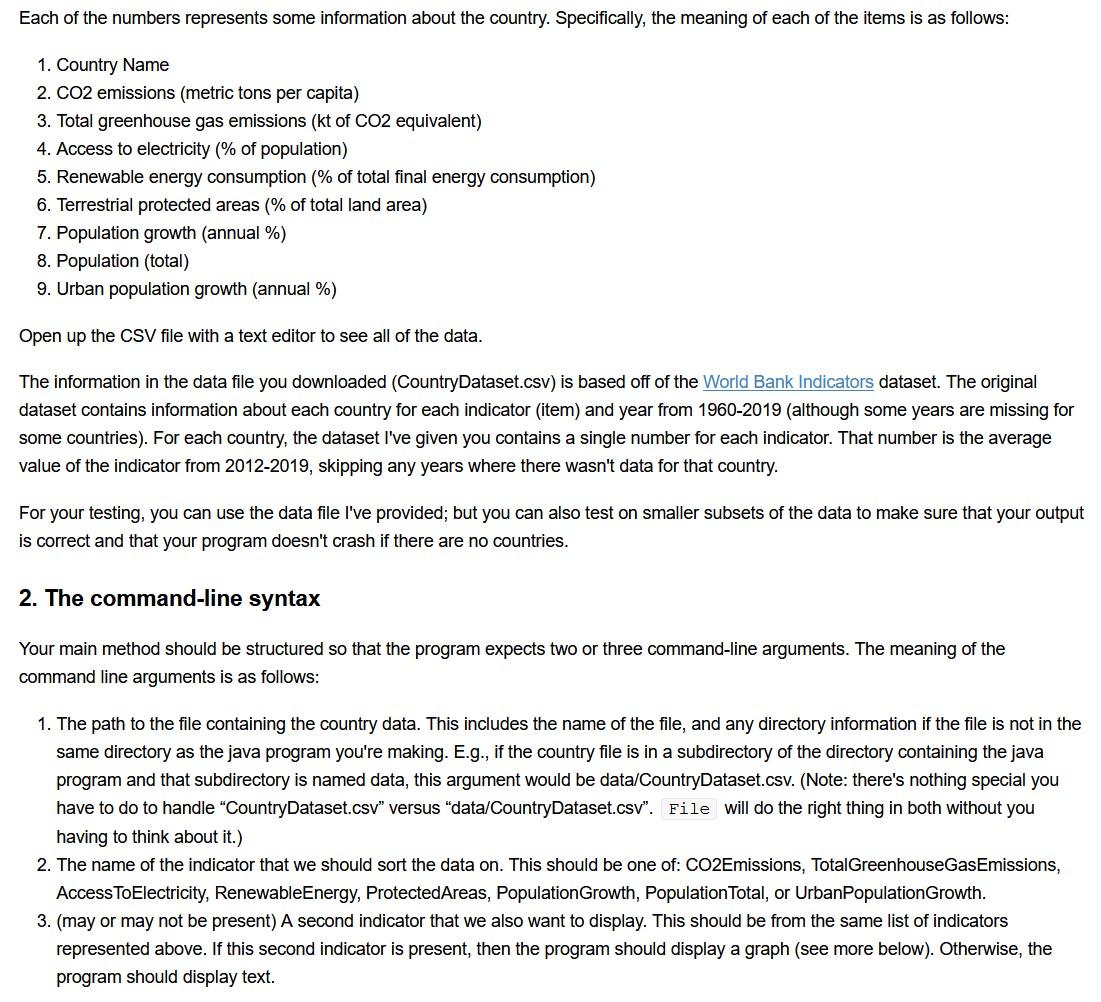
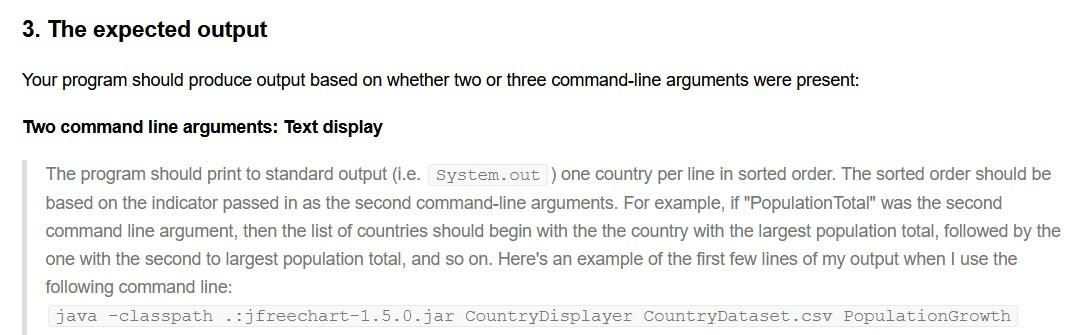
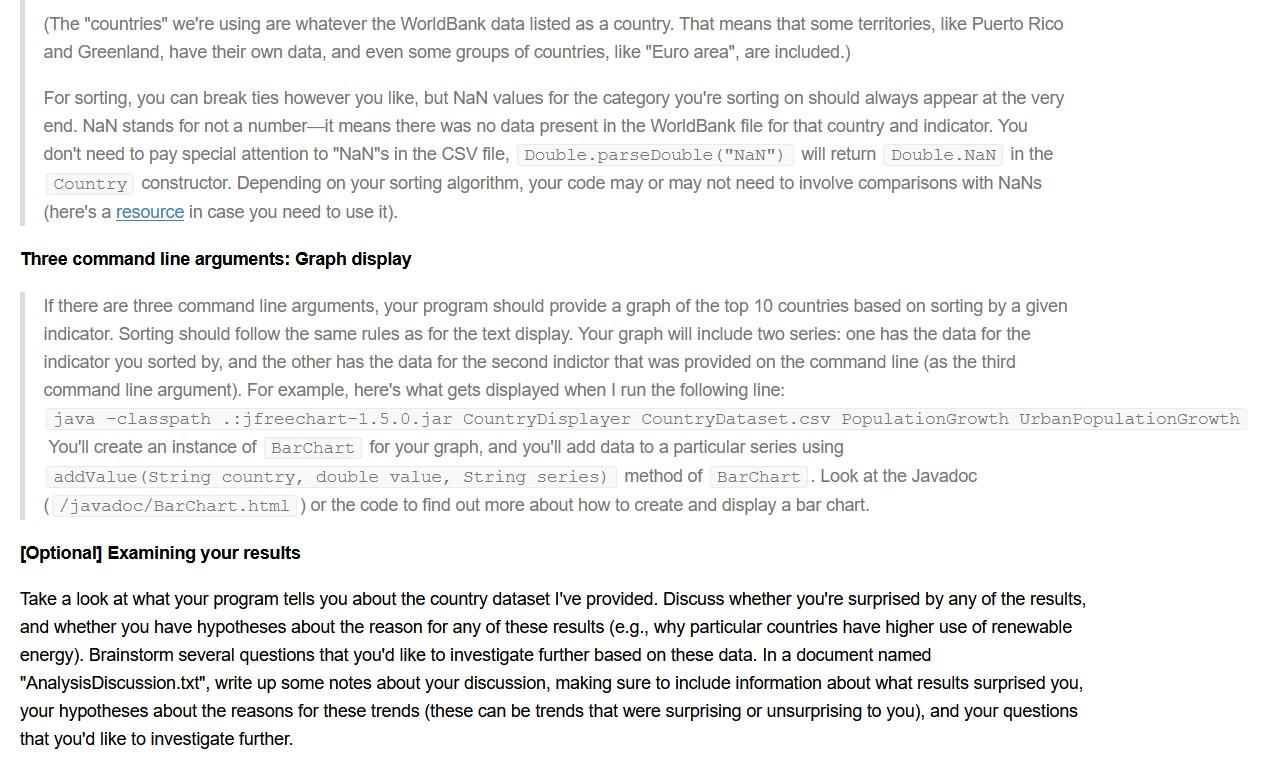
Special Notes We're using a separate Java library to do the graphing, which means that we'll need to tell the compiler and the Java virtual machine (JVM) about that library. Specifically, we have to tell it to include those classes on the classpath the set of classes that the program has access to see this Stackoverflow question and answer for a little more info). You'll do this by adding a classpath argument when you compile and run the program. So, when you want to compile (on a Mac), navigate to the directory with your code, which should also contain BarChart.java and jfreechart-1.5.0.jar , and run: javac -classpath .:jfreechart-1.5.0.jar *.java That tells the compiler to include the current directory (.) and the classes in the jar file when compiling. Then to run your program, type: java -classpath .:jfreechart-1.5.0.jar CountryDisplayer and put your command-line arguments after Country Displayer. Note: If you're on Windows, replace ".." with ".;". If on your own machine (any operating system), you get a message about Unsupported Major/Minor Version error, it means you're running a different version of Java than the jar was compiled with. Use the lab machines or change to JDK15. This Assignment For this assignment, you will write a program that reads from a text file with one line for each country. Your program will need to represent each country as an instance of a class Country . It will need to convert the text file data into a List and display the data in one of two forms: As a graph of the top 10 countries for a given indicator, in sorted order (descendeng). An "indicator" is one of the types of data in the file-e.g., CO2 emissions per capita. As a text list of all countries, in sorted order for a given indicator. 1 This will give you practice working with the List ADT, String, File Scanner , loops, and simple classes. It's also a chance to see how your programming skills might be used to analyze large datasets. 1. The input file format The input file is a text file that contains 0 or more lines of countries, with an initial line that gives the meaning of each item in the line. After that first line, each line of the input file will represent a single country via a comma-delimited list. Here's an example of the representation of Afghanistan, the alphabetically first country: Each of the numbers represents some information about the country. Specifically, the meaning of each of the items is as follows: 1. Country Name 2. CO2 emissions (metric tons per capita) 3. Total greenhouse gas emissions (kt of CO2 equivalent) 4. Access to electricity (% of population) 5. Renewable energy consumption (% of total final energy consumption) 6. Terrestrial protected areas (% of total land area) 7. Population growth (annual %) 8. Population (total) 9. Urban population growth (annual %) Open up the CSV file with a text editor to see all of the data. The information in the data file you downloaded (CountryDataset.csv) is based off of the World Bank Indicators dataset. The original dataset contains information about each country for each indicator (item) and year from 1960-2019 (although some years are missing for some countries). For each country, the dataset I've given you contains a single number for each indicator. That number is the average value of the indicator from 2012-2019, skipping any years where there wasn't data for that country. For your testing, you can use the data file I've provided; but you can also test on smaller subsets of the data to make sure that your output is correct and that your program doesn't crash if there are no countries. 2. The command-line syntax Your main method should be structured so that the program expects two or three command-line arguments. The meaning of the command line arguments is as follows: 1. The path to the file containing the country data. This includes the name of the file, and any directory information if the file is not in the same directory as the java program you're making. E.g., if the country file is in a subdirectory of the directory containing the java program and that subdirectory is named data, this argument would be data/CountryDataset.csv. (Note: there's nothing special you have to do to handle "CountryDataset.csv" versus "data/CountryDataset.csv". File will do the right thing in both without you having to think about it.) 2. The name of the indicator that we should sort the data on. This should be one of: CO2Emissions, TotalGreenhouse GasEmissions, AccessToElectricity, RenewableEnergy, Protected Areas, Population Growth, Population Total, or UrbanPopulation Growth. 3. (may or may not be present) A second indicator that we also want to display. This should be from the same list of indicators represented above. If this second indicator is present, then the program should display a graph (see more below). Otherwise, the program should display text. 3. The expected output Your program should produce output based on whether two or three command-line arguments were present: Two command line arguments: Text display The program should print to standard output (i.e. System.out ) one country per line in sorted order. The sorted order should be based on the indicator passed in as the second command-line arguments. For example, if "Population Total" was the second command line argument, then the list of countries should begin with the the country with the largest population total, followed by the one with the second to largest population total, and so on. Here's an example of the first few lines of my output when I use the following command line: java -classpath ..jfreechart-1.5.0.jar CountryDisplayer CountryDataset.csv PopulationGrowth (The "countries" we're using are whatever the WorldBank data listed as a country. That means that some territories, like Puerto Rico and Greenland, have their own data, and even some groups of countries, like "Euro area", are included.) For sorting, you can break ties however you like, but NaN values for the category you're sorting on should always appear at the very end. NaN stands for not a numberit means there was no data present in the WorldBank file for that country and indicator. You don't need to pay special attention to "NaN"s in the CSV file, Double.parseDouble ("NaN") will return Double.Nan in the Country constructor. Depending on your sorting algorithm, your code may or may not need to involve comparisons with NaNs (here's a resource in case you need to use it). Three command line arguments: Graph display If there are three command line arguments, your program should provide a graph of the top 10 countries based on sorting by a given indicator. Sorting should follow the same rules as for the text display. Your graph will include two series: one has the data for the indicator you sorted by, and the other has the data for the second indictor that was provided on the command line (as the third command line argument). For example, here's what gets displayed when I run the following line: java -classpath .jfreechart-1.5.0.jar CountryDisplayer CountryDataset.csv PopulationGrowth UrbanPopulationGrowth You'll create an instance of Barchart for your graph, and you'll add data to a particular series using addValue (String country, double value, String series) method of Barchart . Look at the Javadoc (/javadoc/BarChart.html ) or the code to find out more about how to create and display a bar chart. [Optional] Examining your results Take a look at what your program tells you about the country dataset I've provided. Discuss whether you're surprised by any of the results, and whether you have hypotheses about the reason for any of these results (e.g., why particular countries have higher use of renewable energy). Brainstorm several questions that you'd like to investigate further based on these data. In a document named "Analysis Discussion.txt", write up some notes about your discussion, making sure to include information about what results surprised you, your hypotheses about the reasons for these trends (these can be trends that were surprising or unsurprising to you), and your questions that you'd like to investigate further. The parameter String[] countryData of the constructor is an array of string s. Refer to Supplement 1.86-96 for arrays. Make sure you understand the constructor: Search the Double.parseDouble() method in the official Javadoc; Double is the wrapper class for double (see S1.97-105). Make sure this file compiles and passes the tests before moving to the next step. For example, to test the toString method using the existing code in main : java Country shoud display Country1, 1.0,2.0,3.0, 4.0,5.0, 6.0,7.0, 8.0 Country2,9.0,3.0, Nan, 6.0,5.0, 4.0,3.0,2.0 Add more tests for other methods. Step 2: Designing the CountryDisplayer class CountryDisplayer class has one data field which stores a list of countries. You should make sure that you put major self-contained operations into separate methods. This way, the main method reads like a high-level outline of the process you're implementing, rather than being a mess of all the code in a single method. For example, the following code shows some essential methods in CountryDisplayer (you're welcome to follow this example, but not required to). Step 3: Implementing the constructor of CountryDisplayer The constructor takes one argument: a string with the location of the file with the countries (e.g., "CountryDataset.csv" ). Make sure to test that your Country Displayer properly loads different files of country data. Your program should never throw an exception or error message if given a valid filename that has a properly formatted country dataset containing 0 or more countries). However, you don't need to worry about recovering if the user gives you a file that doesn't look like the example one. You might find the LineReader.java from HW1 and the split method of String class helpful (Supplement 2 also provides more details about dealing with Files). Suppose line is a string variable representing one line of text read from the CSV file (data separated by commas), then line.split(",") would return a String array ( String[] ) where each element is one data entry. You can use this returned String array as the argument for the Country constructor: Country country = new Country (line.split(",")); Add some testing code in main, and then compile and run it by: javac CountryDisplayer.java java CountryDisplayer CountryDataset.csv Depending on your design in Step 2, you might go through the following two steps in slightly different order. Choose the order that makes sense to you. Step 4: Displaying the countries Next, implement the method displayTextCountries () that prints out the country list, from the first country to the last country. This method will also help you see the result of sorting in Step 5. Modify main so that you can have the option of testing this functionality by passing in two command-line arguments. Then, compile and run it by: javac CountryDisplayer.java java CountryDisplayer CountryDataset.csv Step 5: Tips for implementing the sorting functionality Modularity is especially important for sorting you don't want to have completely different sorting methods for all of the different possible indicators. Think carefully about how to avoid duplicating code. You might need to implement some helper methods to make the sorting part shorter and more readable. One helper method I highly recommend is a getDataEntry method (implement this first!): 1 /** * returns the data entry of the Country at the specified index in the list, and with the specified column name. 2 3 4 private double getDataEntry(int index, String column) { 5 For example, getDataEntry(10, "PopulationGrowth") would return the population growth of the 11th country in the list (indexing starts with O for lists in Java Class Library). I made this method "private" because I don't intend to allow clients of this class to use itit's for internal use only. (Optional: You may be interested in using a switch statement in your code to deal with multiple string options. You can read about switch statements in Supplement 1.51 in your book.) Test it before moving on. Step 6: Implementing displayCountryGraph method While the Barchart class might look complicated at first, you should only need to use a few methods: a constructor, the addvalue method, and displayChart . Take a look at the javadoc to learn how to use these methods, and experiment if you're not sure! As mentioned before, you'll create an instance of Barchart for your graph, and you'll add data to a particular series using addValue (String country, double value, String series) method of Barchart . Modify main so that you can have the option of testing this functionality by passing in three command-line arguments. As noted above, to compile all of the files in a folder at one time and include the jar file with the graphing classes, you can run javac -classpath .:jfreechart-1.5.0.jar *.java while in that folder. The "* java" means anything that ends with ".java". If the user doesn't properly type in an indicator as the second command-line argument, or if they have a third command-line argument that isn't one of the indicators, display a helpful message for them about how to use your classthis is called a usage statement. Special Notes We're using a separate Java library to do the graphing, which means that we'll need to tell the compiler and the Java virtual machine (JVM) about that library. Specifically, we have to tell it to include those classes on the classpath the set of classes that the program has access to see this Stackoverflow question and answer for a little more info). You'll do this by adding a classpath argument when you compile and run the program. So, when you want to compile (on a Mac), navigate to the directory with your code, which should also contain BarChart.java and jfreechart-1.5.0.jar , and run: javac -classpath .:jfreechart-1.5.0.jar *.java That tells the compiler to include the current directory (.) and the classes in the jar file when compiling. Then to run your program, type: java -classpath .:jfreechart-1.5.0.jar CountryDisplayer and put your command-line arguments after Country Displayer. Note: If you're on Windows, replace ".." with ".;". If on your own machine (any operating system), you get a message about Unsupported Major/Minor Version error, it means you're running a different version of Java than the jar was compiled with. Use the lab machines or change to JDK15. This Assignment For this assignment, you will write a program that reads from a text file with one line for each country. Your program will need to represent each country as an instance of a class Country . It will need to convert the text file data into a List and display the data in one of two forms: As a graph of the top 10 countries for a given indicator, in sorted order (descendeng). An "indicator" is one of the types of data in the file-e.g., CO2 emissions per capita. As a text list of all countries, in sorted order for a given indicator. 1 This will give you practice working with the List ADT, String, File Scanner , loops, and simple classes. It's also a chance to see how your programming skills might be used to analyze large datasets. 1. The input file format The input file is a text file that contains 0 or more lines of countries, with an initial line that gives the meaning of each item in the line. After that first line, each line of the input file will represent a single country via a comma-delimited list. Here's an example of the representation of Afghanistan, the alphabetically first country: Each of the numbers represents some information about the country. Specifically, the meaning of each of the items is as follows: 1. Country Name 2. CO2 emissions (metric tons per capita) 3. Total greenhouse gas emissions (kt of CO2 equivalent) 4. Access to electricity (% of population) 5. Renewable energy consumption (% of total final energy consumption) 6. Terrestrial protected areas (% of total land area) 7. Population growth (annual %) 8. Population (total) 9. Urban population growth (annual %) Open up the CSV file with a text editor to see all of the data. The information in the data file you downloaded (CountryDataset.csv) is based off of the World Bank Indicators dataset. The original dataset contains information about each country for each indicator (item) and year from 1960-2019 (although some years are missing for some countries). For each country, the dataset I've given you contains a single number for each indicator. That number is the average value of the indicator from 2012-2019, skipping any years where there wasn't data for that country. For your testing, you can use the data file I've provided; but you can also test on smaller subsets of the data to make sure that your output is correct and that your program doesn't crash if there are no countries. 2. The command-line syntax Your main method should be structured so that the program expects two or three command-line arguments. The meaning of the command line arguments is as follows: 1. The path to the file containing the country data. This includes the name of the file, and any directory information if the file is not in the same directory as the java program you're making. E.g., if the country file is in a subdirectory of the directory containing the java program and that subdirectory is named data, this argument would be data/CountryDataset.csv. (Note: there's nothing special you have to do to handle "CountryDataset.csv" versus "data/CountryDataset.csv". File will do the right thing in both without you having to think about it.) 2. The name of the indicator that we should sort the data on. This should be one of: CO2Emissions, TotalGreenhouse GasEmissions, AccessToElectricity, RenewableEnergy, Protected Areas, Population Growth, Population Total, or UrbanPopulation Growth. 3. (may or may not be present) A second indicator that we also want to display. This should be from the same list of indicators represented above. If this second indicator is present, then the program should display a graph (see more below). Otherwise, the program should display text. 3. The expected output Your program should produce output based on whether two or three command-line arguments were present: Two command line arguments: Text display The program should print to standard output (i.e. System.out ) one country per line in sorted order. The sorted order should be based on the indicator passed in as the second command-line arguments. For example, if "Population Total" was the second command line argument, then the list of countries should begin with the the country with the largest population total, followed by the one with the second to largest population total, and so on. Here's an example of the first few lines of my output when I use the following command line: java -classpath ..jfreechart-1.5.0.jar CountryDisplayer CountryDataset.csv PopulationGrowth (The "countries" we're using are whatever the WorldBank data listed as a country. That means that some territories, like Puerto Rico and Greenland, have their own data, and even some groups of countries, like "Euro area", are included.) For sorting, you can break ties however you like, but NaN values for the category you're sorting on should always appear at the very end. NaN stands for not a numberit means there was no data present in the WorldBank file for that country and indicator. You don't need to pay special attention to "NaN"s in the CSV file, Double.parseDouble ("NaN") will return Double.Nan in the Country constructor. Depending on your sorting algorithm, your code may or may not need to involve comparisons with NaNs (here's a resource in case you need to use it). Three command line arguments: Graph display If there are three command line arguments, your program should provide a graph of the top 10 countries based on sorting by a given indicator. Sorting should follow the same rules as for the text display. Your graph will include two series: one has the data for the indicator you sorted by, and the other has the data for the second indictor that was provided on the command line (as the third command line argument). For example, here's what gets displayed when I run the following line: java -classpath .jfreechart-1.5.0.jar CountryDisplayer CountryDataset.csv PopulationGrowth UrbanPopulationGrowth You'll create an instance of Barchart for your graph, and you'll add data to a particular series using addValue (String country, double value, String series) method of Barchart . Look at the Javadoc (/javadoc/BarChart.html ) or the code to find out more about how to create and display a bar chart. [Optional] Examining your results Take a look at what your program tells you about the country dataset I've provided. Discuss whether you're surprised by any of the results, and whether you have hypotheses about the reason for any of these results (e.g., why particular countries have higher use of renewable energy). Brainstorm several questions that you'd like to investigate further based on these data. In a document named "Analysis Discussion.txt", write up some notes about your discussion, making sure to include information about what results surprised you, your hypotheses about the reasons for these trends (these can be trends that were surprising or unsurprising to you), and your questions that you'd like to investigate further. The parameter String[] countryData of the constructor is an array of string s. Refer to Supplement 1.86-96 for arrays. Make sure you understand the constructor: Search the Double.parseDouble() method in the official Javadoc; Double is the wrapper class for double (see S1.97-105). Make sure this file compiles and passes the tests before moving to the next step. For example, to test the toString method using the existing code in main : java Country shoud display Country1, 1.0,2.0,3.0, 4.0,5.0, 6.0,7.0, 8.0 Country2,9.0,3.0, Nan, 6.0,5.0, 4.0,3.0,2.0 Add more tests for other methods. Step 2: Designing the CountryDisplayer class CountryDisplayer class has one data field which stores a list of countries. You should make sure that you put major self-contained operations into separate methods. This way, the main method reads like a high-level outline of the process you're implementing, rather than being a mess of all the code in a single method. For example, the following code shows some essential methods in CountryDisplayer (you're welcome to follow this example, but not required to). Step 3: Implementing the constructor of CountryDisplayer The constructor takes one argument: a string with the location of the file with the countries (e.g., "CountryDataset.csv" ). Make sure to test that your Country Displayer properly loads different files of country data. Your program should never throw an exception or error message if given a valid filename that has a properly formatted country dataset containing 0 or more countries). However, you don't need to worry about recovering if the user gives you a file that doesn't look like the example one. You might find the LineReader.java from HW1 and the split method of String class helpful (Supplement 2 also provides more details about dealing with Files). Suppose line is a string variable representing one line of text read from the CSV file (data separated by commas), then line.split(",") would return a String array ( String[] ) where each element is one data entry. You can use this returned String array as the argument for the Country constructor: Country country = new Country (line.split(",")); Add some testing code in main, and then compile and run it by: javac CountryDisplayer.java java CountryDisplayer CountryDataset.csv Depending on your design in Step 2, you might go through the following two steps in slightly different order. Choose the order that makes sense to you. Step 4: Displaying the countries Next, implement the method displayTextCountries () that prints out the country list, from the first country to the last country. This method will also help you see the result of sorting in Step 5. Modify main so that you can have the option of testing this functionality by passing in two command-line arguments. Then, compile and run it by: javac CountryDisplayer.java java CountryDisplayer CountryDataset.csv Step 5: Tips for implementing the sorting functionality Modularity is especially important for sorting you don't want to have completely different sorting methods for all of the different possible indicators. Think carefully about how to avoid duplicating code. You might need to implement some helper methods to make the sorting part shorter and more readable. One helper method I highly recommend is a getDataEntry method (implement this first!): 1 /** * returns the data entry of the Country at the specified index in the list, and with the specified column name. 2 3 4 private double getDataEntry(int index, String column) { 5 For example, getDataEntry(10, "PopulationGrowth") would return the population growth of the 11th country in the list (indexing starts with O for lists in Java Class Library). I made this method "private" because I don't intend to allow clients of this class to use itit's for internal use only. (Optional: You may be interested in using a switch statement in your code to deal with multiple string options. You can read about switch statements in Supplement 1.51 in your book.) Test it before moving on. Step 6: Implementing displayCountryGraph method While the Barchart class might look complicated at first, you should only need to use a few methods: a constructor, the addvalue method, and displayChart . Take a look at the javadoc to learn how to use these methods, and experiment if you're not sure! As mentioned before, you'll create an instance of Barchart for your graph, and you'll add data to a particular series using addValue (String country, double value, String series) method of Barchart . Modify main so that you can have the option of testing this functionality by passing in three command-line arguments. As noted above, to compile all of the files in a folder at one time and include the jar file with the graphing classes, you can run javac -classpath .:jfreechart-1.5.0.jar *.java while in that folder. The "* java" means anything that ends with ".java". If the user doesn't properly type in an indicator as the second command-line argument, or if they have a third command-line argument that isn't one of the indicators, display a helpful message for them about how to use your classthis is called a usage statement


