

Question
JAVA Instructions: the code is almost complete, the goal is to read a data.tsv file which is attached on here, it should read the file
JAVA
Instructions: the code is almost complete, the goal is to read a data.tsv file which is attached on here, it should read the file and have an output similar to the one shown in the first image... There are missing steps that I cant seem to figure out to match the output
Project 1 Main file
package project1;
import java.util.Scanner;
public class Project1 { public static void main(String[] args) { Scanner input = new Scanner(System.in); System.out.println("Enter file: "); //String file = input.next(); String file = "data.tsv"; System.out.println("Enter column name: "); //String col = input.next(); String col = "Alpha"; System.out.println("Reading column " + col + " from " + file); Stats s = new Stats(file); s.display(); s.display(col); } }
Stats File
package project1;
import java.io.*; import java.util.Arrays;
public class Stats { private String[] headers; private int[][] data; // copy to private data public Stats(String[] headers, int[][] datin) { } public Stats(String file) // read TSV { } public void display() // For debugging { System.out.println(Arrays.toString(this.headers)); for (int[] x:this.data) { System.out.println(Arrays.toString(x)); } } private int indexAt(String col) { } public void display(String col) { if (this.indexAt(col)
DATA.TSV file
Alpha Beta 1 6 2 7 2 8 3 7 5 6
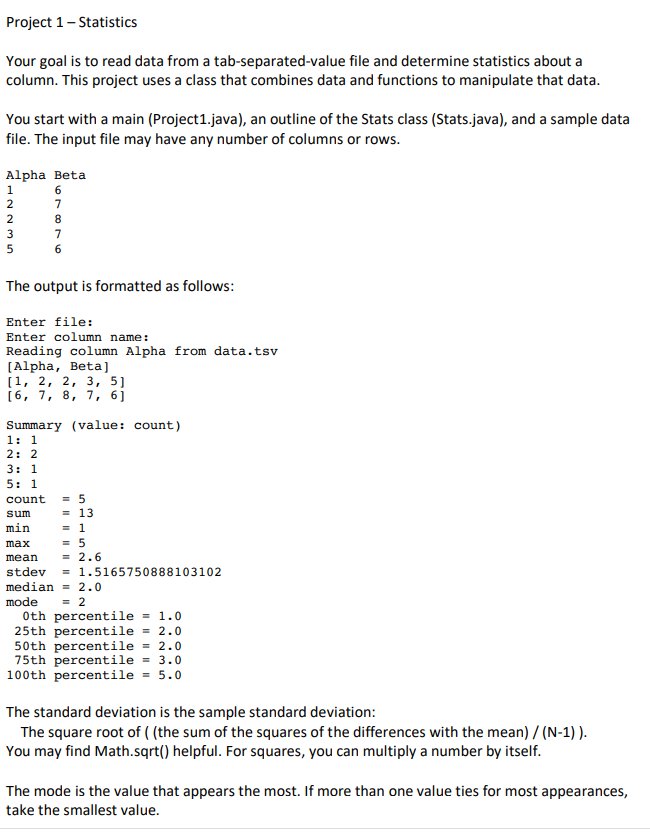
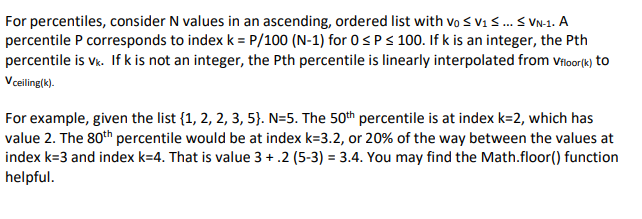
Project 1 - Statistics Your goal is to read data from a tab-separated-value file and determine statistics about a column. This project uses a class that combines data and functions to manipulate that data. You start with a main (Project 1.java), an outline of the Stats class (Stats.java), and a sample data file. The input file may have any number of columns or rows. Alpha Beta UWNN The output is formatted as follows: Enter file: Enter column name: Reading column Alpha from data.tsv [Alpha, Beta) [1, 2, 2, 3, 5] [6, 7, 8, 7, 6] Summary (value: count) 1: 1 2: 2 3: 1 5: 1 count = 5 sum = 13 min = 1 max = 5 mean = 2.6 stdev = 1.5165750888103102 median = 2.0 mode = 2 Oth percentile = 1.0 25th percentile = 2.0 50th percentile = 2.0 75th percentile = 3.0 100th percentile = 5.0 The standard deviation is the sample standard deviation: The square root of ((the sum of the squares of the differences with the mean)/(N-1)). You may find Math.sqrt() helpful. For squares, you can multiply a number by itself. The mode is the value that appears the most. If more than one value ties for most appearances, take the smallest value. For percentiles, consider N values in an ascending, ordered list with vo Svi s... S VN-1. A percentile P corresponds to index k = P/100 (N-1) for OSP s 100. If k is an integer, the Pth percentile is Vk. If k is not an integer, the Pth percentile is linearly interpolated from Vfloor(k) to V ceiling(k). For example, given the list {1, 2, 2, 3, 5). N=5. The 50th percentile is at index k=2, which has value 2. The 80th percentile would be at index k=3.2, or 20% of the way between the values at index k=3 and index k=4. That is value 3+.2 (5-3) = 3.4. You may find the Math.floor() function helpful. Project 1 - Statistics Your goal is to read data from a tab-separated-value file and determine statistics about a column. This project uses a class that combines data and functions to manipulate that data. You start with a main (Project 1.java), an outline of the Stats class (Stats.java), and a sample data file. The input file may have any number of columns or rows. Alpha Beta UWNN The output is formatted as follows: Enter file: Enter column name: Reading column Alpha from data.tsv [Alpha, Beta) [1, 2, 2, 3, 5] [6, 7, 8, 7, 6] Summary (value: count) 1: 1 2: 2 3: 1 5: 1 count = 5 sum = 13 min = 1 max = 5 mean = 2.6 stdev = 1.5165750888103102 median = 2.0 mode = 2 Oth percentile = 1.0 25th percentile = 2.0 50th percentile = 2.0 75th percentile = 3.0 100th percentile = 5.0 The standard deviation is the sample standard deviation: The square root of ((the sum of the squares of the differences with the mean)/(N-1)). You may find Math.sqrt() helpful. For squares, you can multiply a number by itself. The mode is the value that appears the most. If more than one value ties for most appearances, take the smallest value. For percentiles, consider N values in an ascending, ordered list with vo Svi s... S VN-1. A percentile P corresponds to index k = P/100 (N-1) for OSP s 100. If k is an integer, the Pth percentile is Vk. If k is not an integer, the Pth percentile is linearly interpolated from Vfloor(k) to V ceiling(k). For example, given the list {1, 2, 2, 3, 5). N=5. The 50th percentile is at index k=2, which has value 2. The 80th percentile would be at index k=3.2, or 20% of the way between the values at index k=3 and index k=4. That is value 3+.2 (5-3) = 3.4. You may find the Math.floor() function helpfulStep by Step Solution
There are 3 Steps involved in it
Step: 1

Get Instant Access to Expert-Tailored Solutions
See step-by-step solutions with expert insights and AI powered tools for academic success
Step: 2

Step: 3
Ace Your Homework with AI
Get the answers you need in no time with our AI-driven, step-by-step assistance
Get Started
Concepts of Database Management
Authors: Philip J. Pratt, Joseph J. Adamski
7th edition
978-1111825911, 1111825912, 978-1133684374, 1133684378, 978-111182591