Answered step by step
Verified Expert Solution
Link Copied!

Question

1 Approved Answer

Java language. Description In this lab you will calculate descriptive statistics of mean and standard deviation for rows and columns of a 4 by 7,
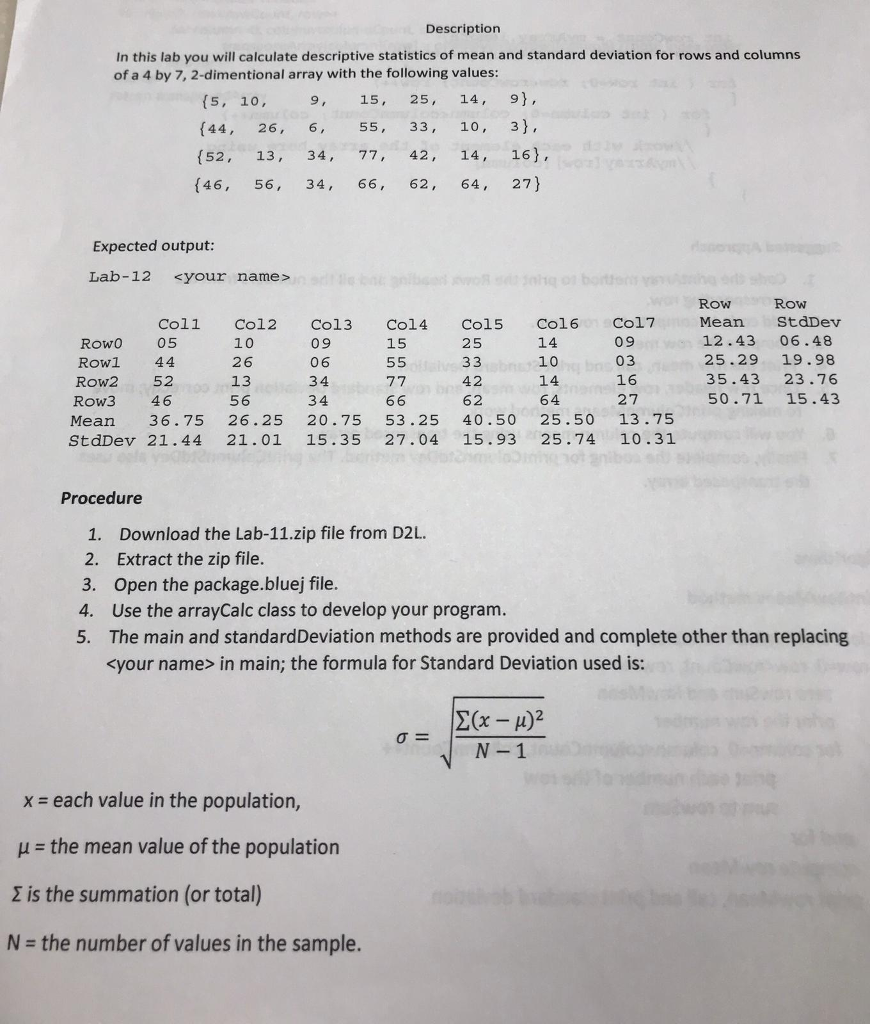
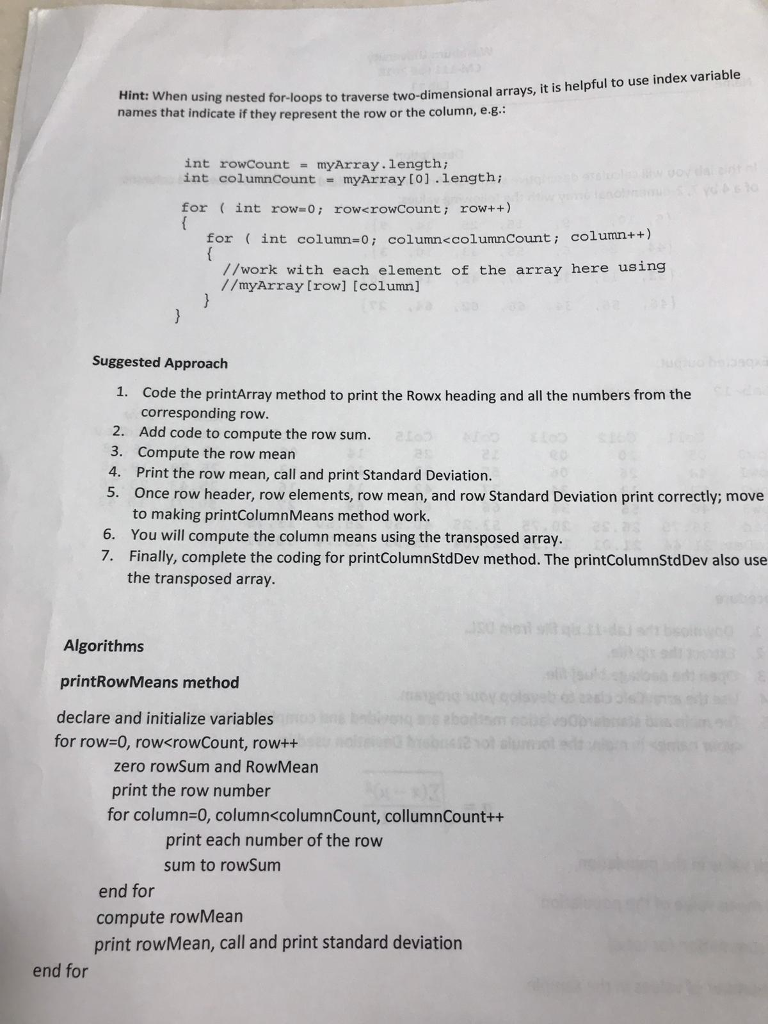
image text in transcribed

image text in transcribed

image text in transcribed

Java language.

Description In this lab you will calculate descriptive statistics of mean and standard deviation for rows and columns of a 4 by 7, 2-dimentional array with the following values: (s, 10, , 15, 25, 14, ) (44, 26, 6, 55, 33, 10, 3), (52, 13, 34, 77, 42, 14, 16) (46, 56, 34, 66, 62, 64, 27) 9, 15, 25, 14, 9), Expected output: Lab-12 RowRow Coll Col2 Co13 Col4 Co15 Col6 Col7Mean StdDev Row0 05 Rowl 44 Row2 52 Row3 46 Mean 36.75 26.25 20.75 53.25 40.50 25.50 13.75 10 26 13 56 09 06 34 34 14 10 14 64 09 03 16 27 12.43 06.48 25.29 19.98 35.43 23.76 50.71 15.43 15 25 42 62 StdDev 21.44 21.01 15.35 27.04 15.93 25.74 10.31 Procedure 1. Download the Lab-11.zip file from D2L 2. Extract the zip file 3. Open the package.bluej file. 4. Use the arrayCalc class to develop your program. 5. The main and standardDeviation methods are provided and complete other than replacing in main; the formula for Standard Deviation used is: N-1 x- each value in the population, H the mean value of the population 2 is the summation (or total) N the number of values in the sample. Hint: When using nested for-loops to tra names that indicate if they represent the row or the column, e.g verse two-dimensional arrays, it is helpful to use index variable int rowcount myArray.length; int columnCount myArray [0].length; for int row o; row
Step by Step Solution

There are 3 Steps involved in it

Step: 1

blur-text-image

Get Instant Access to Expert-Tailored Solutions

See step-by-step solutions with expert insights and AI powered tools for academic success

Step: 2

blur-text-image

Step: 3

blur-text-image

Ace Your Homework with AI

Get the answers you need in no time with our AI-driven, step-by-step assistance

Get Started

Recommended Textbook for

Harness The Power Of Big Data The IBM Big Data Platform

Authors: Paul Zikopoulos, David Corrigan James Giles Thomas Deutsch Krishnan Parasuraman Dirk DeRoos Paul Zikopoulos

1st Edition

0071808183, 9780071808187

More Books

Students also viewed these Databases questions

Question

=+ a. Graph the supply and demand for real money balances.

Answered: 1 week ago

Question

3-18. An advertisement for peanut butter?

Answered: 1 week ago