

Answered step by step
Verified Expert Solution
Question
1 Approved Answer
Java programming: write a program that creates a histogram that allows you to visually inspect the frequency distribution of a set of values. The program
Java programming:
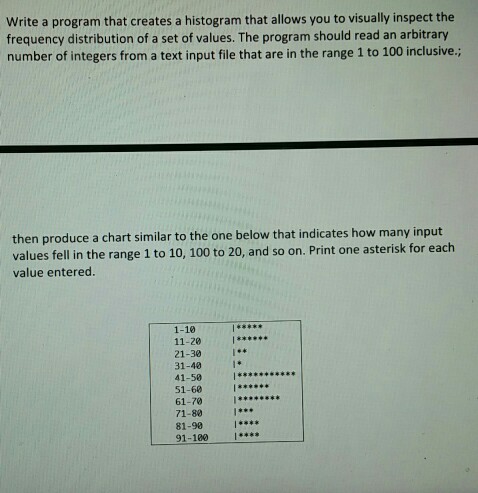
write a program that creates a histogram that allows you to visually inspect the frequency distribution of a set of values. The program should read an arbitrary number of integers from a text input file that are in the range 1 to 100 inclusive. then produce a chart similar to the one below that indicates how many input values fell in the range 1 to 10, 100 to 20, and so on. Print one asterisk for each value entered. 1-10 11-20 21-30 31-40 41-50 51-60 61-70 l******** 71-80 1-90 91-100
Step by Step Solution
There are 3 Steps involved in it
Step: 1

Get Instant Access to Expert-Tailored Solutions
See step-by-step solutions with expert insights and AI powered tools for academic success
Step: 2

Step: 3
Ace Your Homework with AI
Get the answers you need in no time with our AI-driven, step-by-step assistance
Get Started
Harness The Power Of Big Data The IBM Big Data Platform
Authors: Paul Zikopoulos, David Corrigan James Giles Thomas Deutsch Krishnan Parasuraman Dirk DeRoos Paul Zikopoulos
1st Edition
0071808183, 9780071808187