

Answered step by step
Verified Expert Solution
Question
1 Approved Answer
java . . . Write a class called Array Stats that has the following characteristics Instance Variables An Array of Integers Methods A default Constructor
java
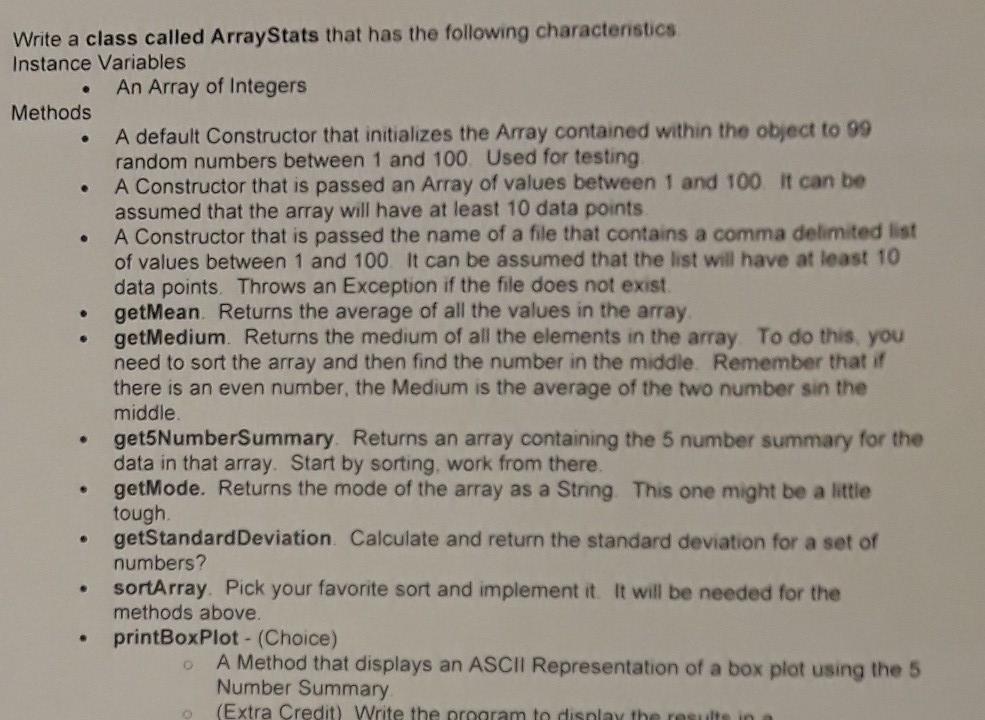
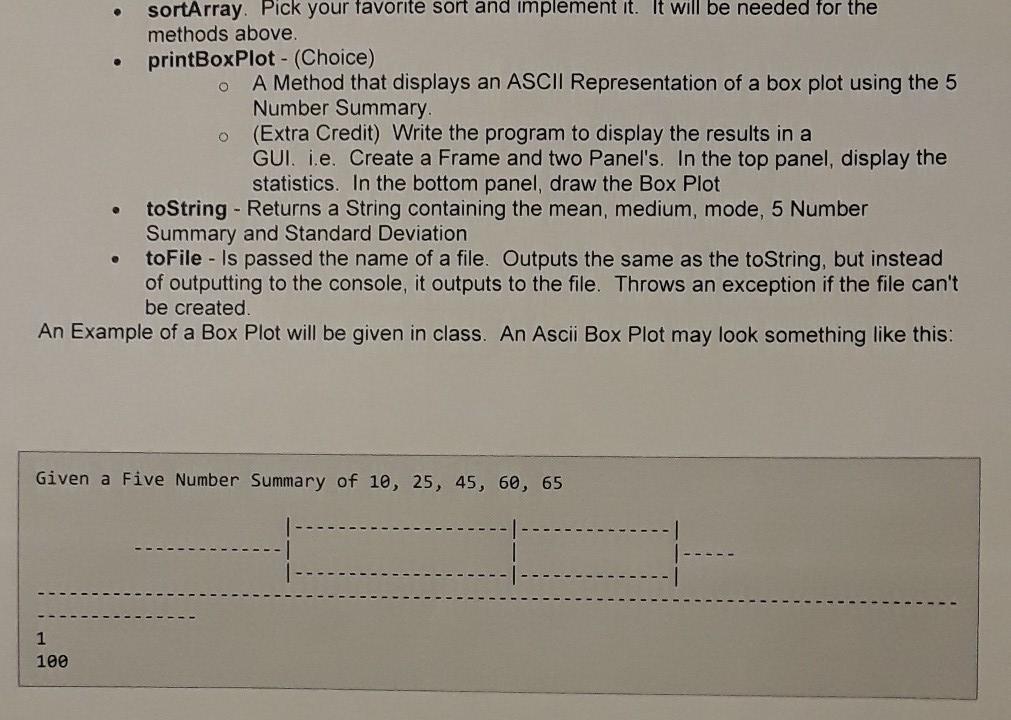
. . . Write a class called Array Stats that has the following characteristics Instance Variables An Array of Integers Methods A default Constructor that initializes the Array contained within the object to 99 random numbers between 1 and 100 Used for testing A Constructor that is passed an Array of values between 1 and 100. It can be assumed that the array will have at least 10 data points A Constructor that is passed the name of a file that contains a comma delimited list of values between 1 and 100. It can be assumed that the list will have at least 10 data points. Throws an Exception if the file does not exist. getMean Returns the average of all the values in the array getMedium Returns the medium of all the elements in the array To do this, you need to sort the array and then find the number in the middle. Remember that if there is an even number, the Medium is the average of the two number sin the middle get5NumberSummary Returns an array containing the 5 number summary for the data in that array. Start by sorting, work from there. getMode. Returns the mode of the array as a Stning. This one might be a little tough getStandard Deviation Calculate and return the standard deviation for a set of numbers? sortArray. Pick your favorite sort and implement it. It will be needed for the methods above. printBoxPlot - (Choice) A Method that displays an ASCII Representation of a box plot using the 5 Number Summary (Extra Credit) Write the program to display the results in a . O sortArray. Pick your favorite sort and implement it. It will be needed for the methods above. printBoxPlot - (Choice) A Method that displays an ASCII Representation of a box plot using the 5 Number Summary (Extra Credit) Write the program to display the results in a GUI. i.e. Create a Frame and two Panel's. In the top panel, display the statistics. In the bottom panel, draw the Box Plot toString - Returns a String containing the mean, medium, mode, 5 Number Summary and Standard Deviation toFile - Is passed the name of a file. Outputs the same as the toString, but instead of outputting to the console, it outputs to the file. Throws an exception if the file can't be created An Example of a Box Plot will be given in class. An Ascii Box Plot may look something like this: Given a Five Number Summary of 10, 25, 45, 60, 65 1 100Step by Step Solution
There are 3 Steps involved in it
Step: 1

Get Instant Access to Expert-Tailored Solutions
See step-by-step solutions with expert insights and AI powered tools for academic success
Step: 2

Step: 3
Ace Your Homework with AI
Get the answers you need in no time with our AI-driven, step-by-step assistance
Get Started
Database Design And Relational Theory Normal Forms And All That Jazz
Authors: Chris Date
1st Edition
1449328016, 978-1449328016