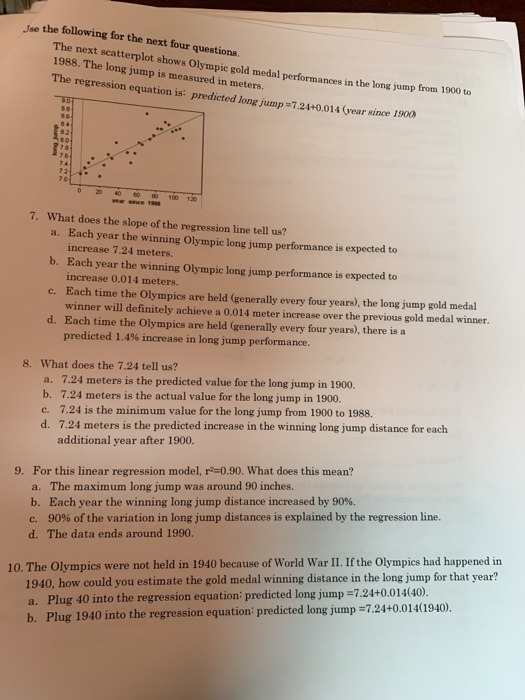
Jee the following for the next four questions The next scatterplot shows Olympic gold medal performances in the long jump from 1900 to 1988. The long jump is measured in meters. The regression equation is: predicted long jump =7.24+0.014 (year since 1900) THE 40 160 120 7. What does the slope of the regression line tell us? a. Each year the winning Olympic long jump performance is expected to increase 7.24 meters. b. Each year the winning Olympic long jump performance is expected to increase 0.014 meters. Each time the Olympics are held (generally every four years), the long jump gold medal winner will definitely achieve a 0.014 meter increase over the previous gold medal winner. d. Each time the Olympics are held (generally every four years), there is a predicted 1.4% increase in long jump performance. 8. What does the 7.24 tell us? a. 7.24 meters is the predicted value for the long jump in 1900. b. 7.24 meters is the actual value for the long jump in 1900. c. 7.24 is the minimum value for the long jump from 1900 to 1988. d. 7.24 meters is the predicted increase in the winning long jump distance for each additional year after 1900. 9. For this linear regression model, r=0.90. What does this mean? a. The maximum long jump was around 90 inches. b. Each year the winning long jump distance increased by 90%. c. 90% of the variation in long jump distances is explained by the regression line. d. The data ends around 1990. 10. The Olympics were not held in 1940 because of World War II. If the Olympics had happened in 1940, how could you estimate the gold medal winning distance in the long jump for that year? a. Plug 40 into the regression equation: predicted long jump =7.24+0.014(40). b. Plug 1940 into the regression equation: predicted long jump =7.24+0.014(1940).6.37. Suppose that (X', Y) has a bivariate normal distribu- tion with parameters fix. Hy. Or. dy. p. Y- HE (#) Show that has a bivariate normal distri- bution with parameters 0. 1.0, 1. p. (b) What is the joint distribution of (ax + b.cy + d)