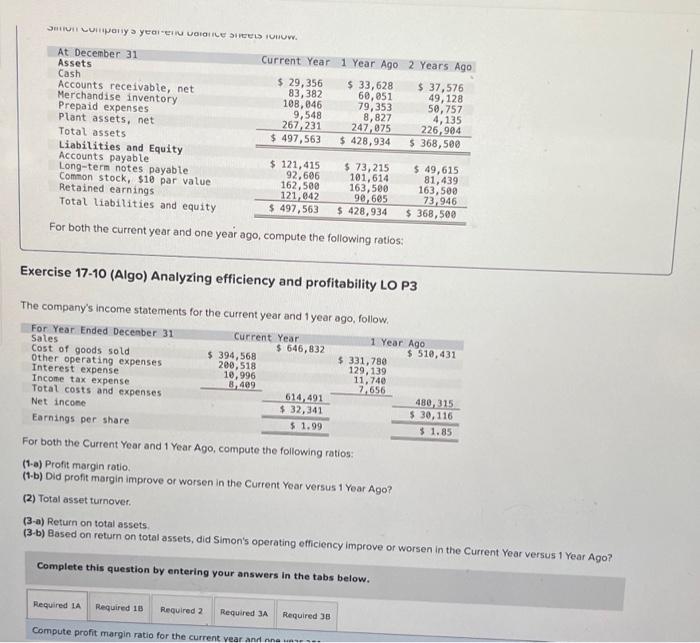
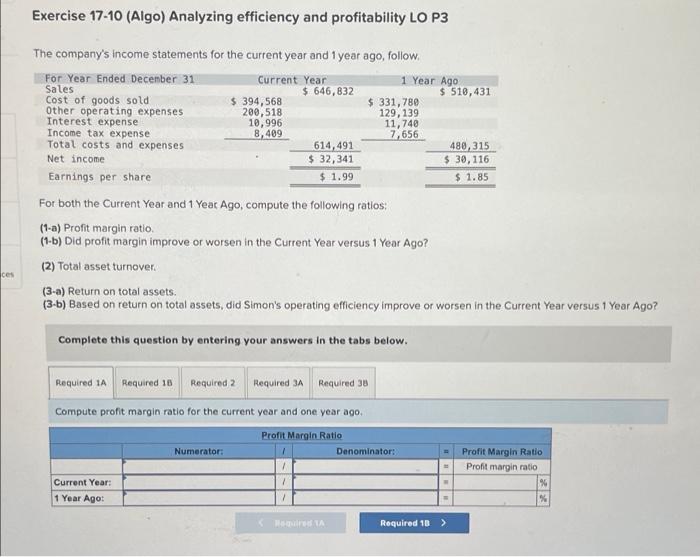
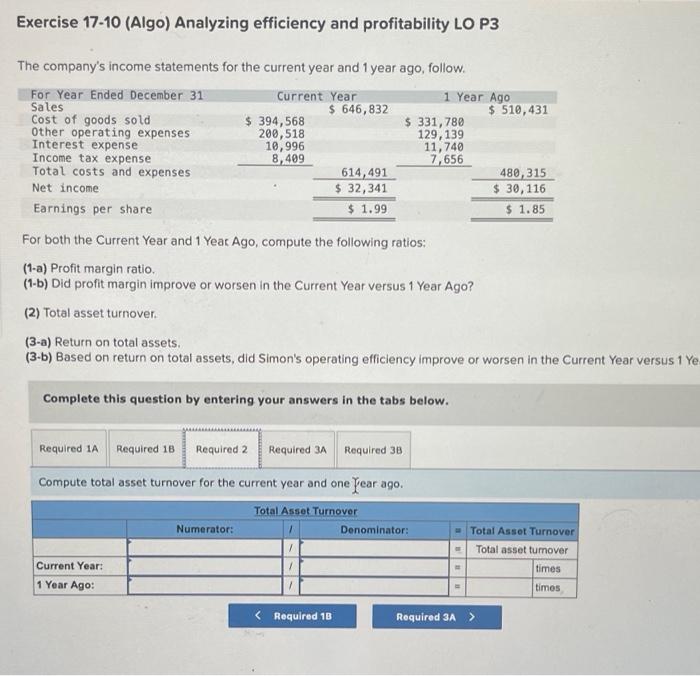
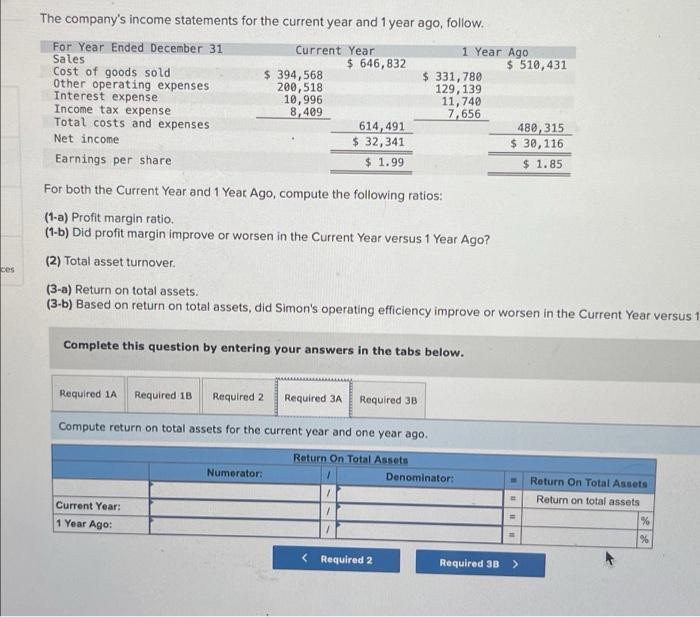
JH Lory > yedi eu VIIILE TW At December 31 Assets Cash Accounts receivable, net Merchandise inventory Prepaid expenses Plant assets, net Total assets Liabilities and Equity Accounts payable Long-term notes payable Common stock, $10 par value Retained earnings Total liabilities and equity Current Year 1 Year Ago 2 Years Ago $ 29,356 $ 33,628 $ 37,576 83, 382 60,051 49, 128 108,046 79,353 50,757 9,548 8,827 4,135 267, 231 247,075 226,904 $ 497,563 $ 428,934 $ 368,500 $ 121, 415 92,606 162,500 121,042 $ 497,563 $ 73,215 101,614 163,500 90,605 $ 428,934 $ 49,615 81,439 163,500 73,946 $ 368,500 For both the current year and one year ago, compute the following ratios: Exercise 17-10 (Algo) Analyzing efficiency and profitability LO P3 The company's income statements for the current year and 1 year ago, follow, For Year Ended Decenber 31 Current Year 1 Year Ago Sales $ 646,832 $ 510,431 Cost of goods sold $ 394,568 $ 331,789 Other operating expenses 200,518 129, 139 Interest expense 10,996 11,740 Income tax expense 8,409 7,656 Total costs and expenses 614,491 480, 315 Net income $. 32, 341 $ 30,116 Earnings per share $ 1.99 $ 1.85 For both the Current Year and 1 Year Ago, compute the following ratios: (1-a) Profit margin ratio. (1.b) Did profit margin improve or worsen in the Current Year versus 1 Year Ago? (2) Total asset turnover. (3-a) Return on total assets. (3-6) Based on return on total assets, did Simon's operating efficiency improve or worsen in the current Year versus 1 Year Ago? Complete this question by entering your answers in the tabs below. Required LA Required 18 Required 2 Required JA Required 35 Compute profit margin ratio for the current year and one Exercise 17-10 (Algo) Analyzing efficiency and profitability LO P3 The company's income statements for the current year and 1 year ago, follow, For Year Ended December 31 Current Year 1 Year Ago Sales $ 646,832 $ 510,431 Cost of goods sold $ 394,568 $ 331,789 Other operating expenses 280,518 129, 139 Interest expense 10,996 11,740 Income tax expense 8,409 7,656 Total costs and expenses 614,491 480,315 Net income $ 32,341 $ 30, 116 Earnings per share $ 1.99 $ 1.85 For both the Current Year and 1 Year Ago, compute the following ratios: (1-a) Profit margin ratio (1-6) Did profit margin improve or worsen in the Current Year versus 1 Year Ago? (2) Total asset turnover (3-a) Return on total assets. (3-6) Based on return on total assets, did Simon's operating efficiency improve or worsen in the Current Year versus 1 Year Ago? ces Complete this question by entering your answers in the tabs below. Required 1A Required 16 Required 2 Required A Required 38 Compute profit margin ratio for the current year and one year ago Profit Margin Ratio Numerator: Denominator: 1 1 Profit Margin Ratio Profit margin ratio 94 Current Year: 1 Year Ago: 1 4 % No 1 Required 18 > Exercise 17-10 (Algo) Analyzing efficiency and profitability LO P3 The company's income statements for the current year and 1 year ago, follow. For Year Ended December 31 Current Year 1 Year Ago Sales $ 646,832 $ 510,431 Cost of goods sold $ 394,568 $ 331,789 Other operating expenses 200,518 129, 139 Interest expense 10,996 11,740 Income tax expense 8,409 7,656 Total costs and expenses 614,491 480,315 Net income $ 32, 341 $ 30,116 Earnings per share $ 1.99 $ 1.85 For both the Current Year and 1 Year Ago, compute the following ratios: (1-a) Profit margin ratio. (1-1) Did profit margin improve or worsen in the Current Year versus 1 Year Ago? (2) Total asset turnover. (3-a) Return on total assets. (3-6) Based on return on total assets, did Simon's operating efficiency improve or worsen in the Current Year versus 1 Ye Complete this question by entering your answers in the tabs below. Required 1A Required 18 Required 2 Required 3A Required 3B Compute total asset turnover for the current year and one year ago Total Assot Turnover Numerator: Denominator: Current Year: Total Asset Turnover Total asset tumover times timos 1 Year Ago: The company's income statements for the current year and 1 year ago, follow. For Year Ended December 31 Current Year 1 Year Ago Sales $ 646,832 $ 510,431 Cost of goods sold $ 394,568 $ 331,780 Other operating expenses 200,518 129, 139 Interest expense 10,996 11,740 Income tax expense 8,409 7,656 Total costs and expenses 614,491 480, 315 Net income $ 32,341 $ 30,116 Earnings per share $ 1.99 $ 1.85 For both the Current Year and 1 Year Ago, compute the following ratios: (1-a) Profit margin ratio. (1-b) Did profit margin improve or worsen in the Current Year versus 1 Year Ago? (2) Total asset turnover. (3-a) Return on total assets. (3-b) Based on return on total assets, did Simon's operating efficiency improve or worsen in the Current Year versus 1 ces Complete this question by entering your answers in the tabs below. Required 1A Required 1B Required 2 Required 3A Required 3B Compute return on total assets for the current year and one year ago Numerator: Return On Total Assets Denominator: Return On Total Assets Return on total assets Current Year: 1 Year Ago: ### % %