Question
Jim Manzano is the general partner of an investment group that owns a number of commercial and industrial properties, including a chain of 15 convenience
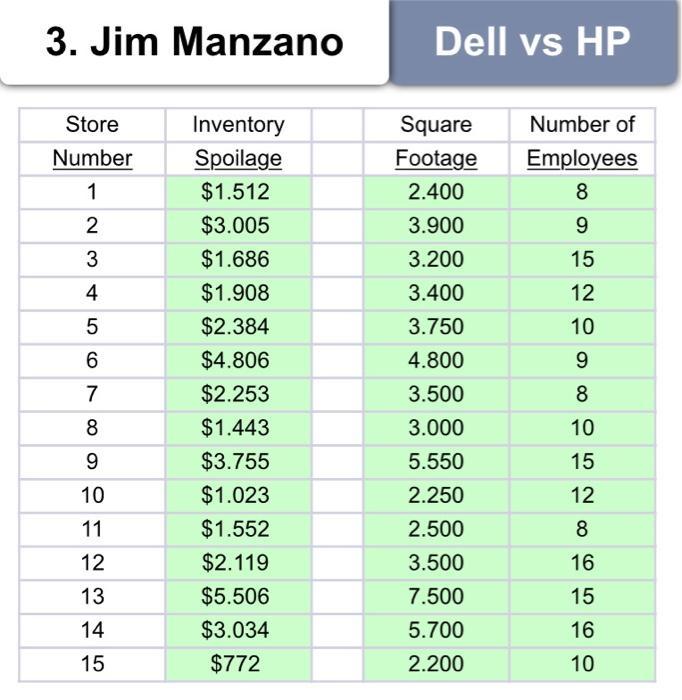
Jim Manzano is the general partner of an investment group that owns a number of commercial and industrial properties, including a chain of 15 convenience stores located in the greater metropolitan area of Cleveland, Ohio. Jim is concerned about the recent increase in inventory theft and waste (he calls it “spoilage”) in his stores. In some stores, the main reason is theft; in others, it is damage and vandalism; and in still others, merchandise actually does spoil and must be thrown out. Jim has collected data on spoilage at each of his stores in recent month and is looking for patterns of spoilage relative to square feet of floor space and number of employees. Jim is not sure, but he suspects, based on his experience managing convenience stores, that a relationship exists among these factors.
Use the attached Excel file containing the data and prepare a regression analysis that predicts inventory spoilage. Given the two potential independent variables (square feet of floor space and number of employees), three regression models are possible: two simple regression models (each of the two variables as an independent variable) and one multiple regression model (both variables as independent variables in a single model). Try the three regression analyses and evaluate the reliability of each regression - judge it based on p values (5% cutoff level) and r square (relative magnitude among the models).
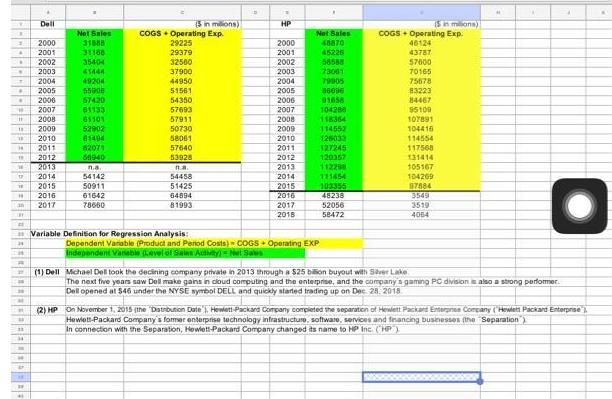
b) Dell vs. HP - data in the second picture
The purpose is to get a sketchy understanding about the two firms' cost structure, considering the relationship between expenses (cogs + operating expenses) and sales revenues.
Model: expenses (cogs + operating expenses) = intercept coefficient + slope coefficient * sales
You can check which firm incurs higher level of fixed costs based on the intercept coefficient (variable costs per sales dollar based on the slope coefficient). Then, think about reasons that the two firms have different cost patterns. One thing to make sure is that HP has an unusual observation (an outlier) and you may want to discard that observation in the regression analysis.


3. Jim Manzano Store Number 1 234567 2 8 9 10 11 12 13 14 15 Inventory Spoilage $1.512 $3.005 $1.686 $1.908 $2.384 $4.806 $2.253 $1.443 $3.755 $1.023 $1.552 $2.119 $5.506 $3.034 $772 Dell vs HP Square Number of Footage 2.400 3.900 3.200 3.400 3.750 4.800 3.500 3.000 5.550 2.250 2.500 3.500 7.500 5.700 2.200 Employees 8 9 15 12 10 9 8 10 15 12 8 16 15 16 10
Step by Step Solution
3.47 Rating (160 Votes )
There are 3 Steps involved in it
Step: 1
Thank you for providing the data on spoilage in Jim Manzanos convenience stores Based on the information provided we can perform regression analyses t...
Get Instant Access to Expert-Tailored Solutions
See step-by-step solutions with expert insights and AI powered tools for academic success
Step: 2

Step: 3

Ace Your Homework with AI
Get the answers you need in no time with our AI-driven, step-by-step assistance
Get Started


