JMP Golf Assignment?
Instructions
- Download the Word docMod 6 JMP assignment.docxdownload
- Use JMP's Fit Model to build your regression model.
- Modify the word doc by pasting the appropriate displays and use them to answer the questions.
- I have specified where to paste each piece of JMP output for the regression analysis.
- Format counts. Make sure your images have a good aspect and are cropped neatly.
JMP Data Set
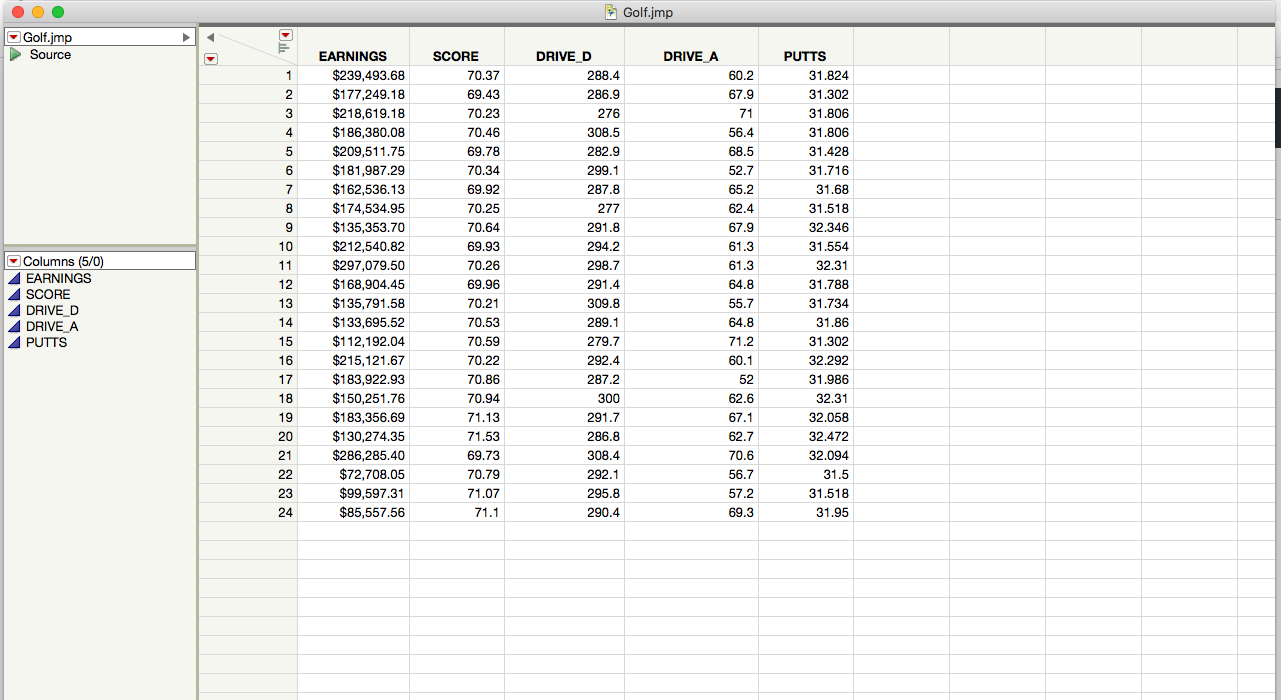
Golf.jmpdownload
Note: If your submission does not include JMP output, you will receive a grade of zero for the assignment.
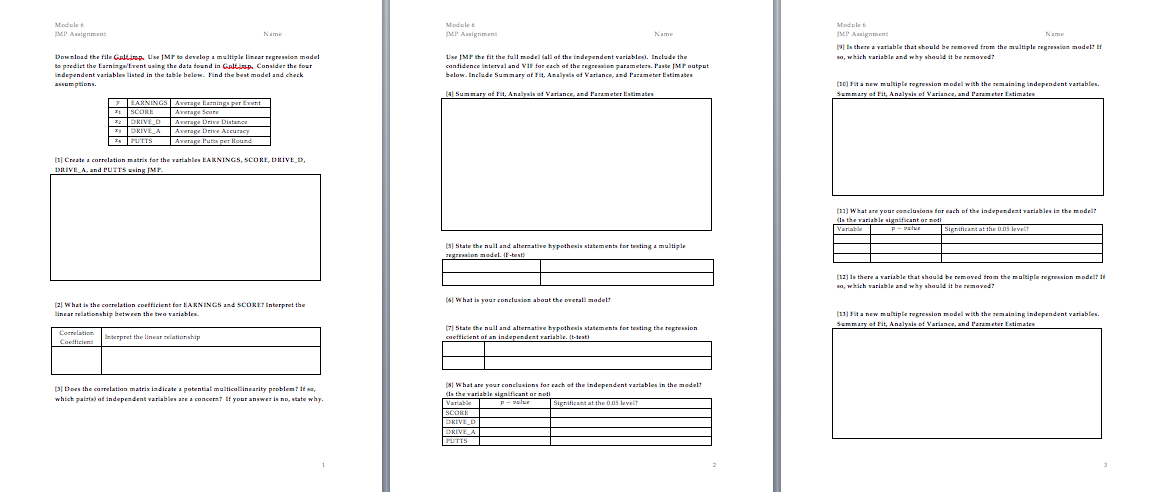
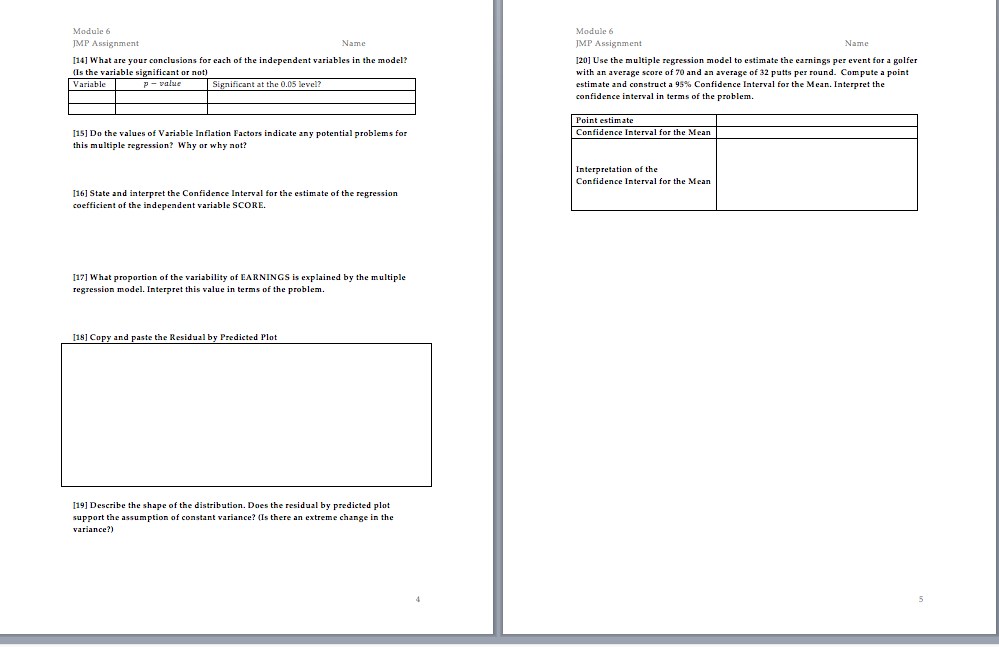
Module s Module s Module s IMP Assignment Name JP Assignment Name JUMP Assignment Name (3) is theme a variable that should be removed from the multiple regression model? If Download the file Calling, Use JMP to develop a multiple linear regression model Use J MP the fit the full model tall of the independent variableal. Include the so, which variable and why should it be removed? to predict the Earnings Event using the data found in Calllap, Consider the four confidence interval and VIP for each of the regression parameters. Paste JMP output Independent variables listed in the table below. Find the best model and check below. Include Summary of Fit, Analysis of Variance, and Parameter Estimates assumptions. (10] Fit a new multiple regression model with the remaining independent variables. Summary of Fit. Analysis of Variance, and Parameter Estimates Summary of Fit, Analysis of Variance, and Parameter Estimates EARNINGS | Average Earnings per Event SCORE Average Scare DRIVE_D Average Drive Distance DRIVE_A Average Drive Accuracy UTIS Average Putts per Round (1] Create a correlation matrix for the variables EARNINGS, SCORE, DRIVE_D, DRIVE_A, and PUTTS using IMP. (1]] What ass your conclusions for each of the independent variables in the model? Is the variable significant or notl Variable p - value Significant at the 0.09 levelt (5) State the null and alternative hypothesis statements for testing a multiple Impression model. (F-tasty (12] Is there a variable that should be removed from the multiple regression modelt if wo, which variable and why should it be removed? (2) What is the correlation cortficient for EARNINGS and SCORE? Interpret the (s) What is your conclusion about the overall model? linear relationship between the two variables. (13] Fit a new multiple regression model with the remaining independent variables. Summary of Fit, Analysis of Variance, and Parameter Estimates Compilation (7) State the null and alternative hypothesis statements for testing the regression Cordficient Interpret the linear relationship coefficient of an independent variable. (t-test) (3] Does the correlation matrix indicate a potential multicallingarity problemt If ss, (s] What are your conclusions for each of the independent variables in the model? which patrial of independent variables are a concerat If your answer is no, state why. Is the variable significant or noll Variable p - value Significant at the 0.09 level SCORE DRIVE_D DRIVE A PUTTSModule 6 Module 6 IMP Assignment Name JMP Assignment Name [14] What are your conclusions for each of the independent variables in the model? [20] Use the multiple regression model to estimate the earnings per event for a golfer (Is the variable significant or not with an average score of 70 and an average of 32 putts per round. Compute a point Variable p - value Significant at the 0.05 level? estimate and construct a 95% Confidence Interval for the Mean. Interpret the confidence interval in terms of the problem. Point estimate [15] Do the values of Variable Inflation Factors indicate any potential problems for Confidence Interval for the Mean this multiple regression? Why or why not? Interpretation of the Confidence Interval for the Mean [16] State and interpret the Confidence Interval for the estimate of the regression coefficient of the independent variable SCORE. [17] What proportion of the variability of EARNINGS is explained by the multiple regression model. Interpret this value in terms of the problem. [18] Copy and paste the Residual by Predicted Plot [19] Describe the shape of the distribution. Does the residual by predicted plot support the assumption of constant variance? (Is there an extreme change in the variance?) 5.. . Golf.jmp Golf.jmp A Source EARNINGS SCORE DRIVE_D DRIVE A PUTTS $239,493.68 70.37 288.4 60.2 31.824 $177,249.18 69.43 286.9 67.9 31.302 $218,619.18 70.23 276 71 31.806 $186,380.08 70.46 308.5 56.4 31.806 $209,511.75 69.78 282.9 68.5 31.428 $181,987.29 70.34 299.1 52.7 31.716 $162,536.13 69.92 287.8 65.2 31.68 $174,534.95 70.25 277 62.4 31.518 $135,353.70 70.64 291.8 67.9 32.346 $212,540.82 69.93 294.2 61.3 31.554 Columns (5/0) 11 $297,079.50 70.26 298.7 61.3 32.31 EARNINGS 12 $168,904.45 69.96 291.4 64.8 31.788 SCORE 13 70.21 309.8 DRIVE_D $135,791.58 55.7 31.734 DRIVE A 14 $133,695.52 70.53 289.1 64.8 31.86 PUTTS 15 $112,192.04 70.59 279.7 71.2 31.302 16 $215,121.67 70.22 292.4 60.1 32.292 17 $183,922.93 70.86 287.2 52 31.986 18 $150,251.76 70.94 300 62.6 32.31 19 $183,356.69 71.13 291.7 57.1 32.058 20 $130,274.35 71.53 286.8 62.7 32.472 21 $286,285.40 69.73 308.4 70.6 32.094 22 $72,708.05 70.79 292.1 56.7 31.5 23 $99,597.31 71.07 295.8 67.2 31.518 24 $85,557.56 71.1 290.4 59.3 31.95


