Question
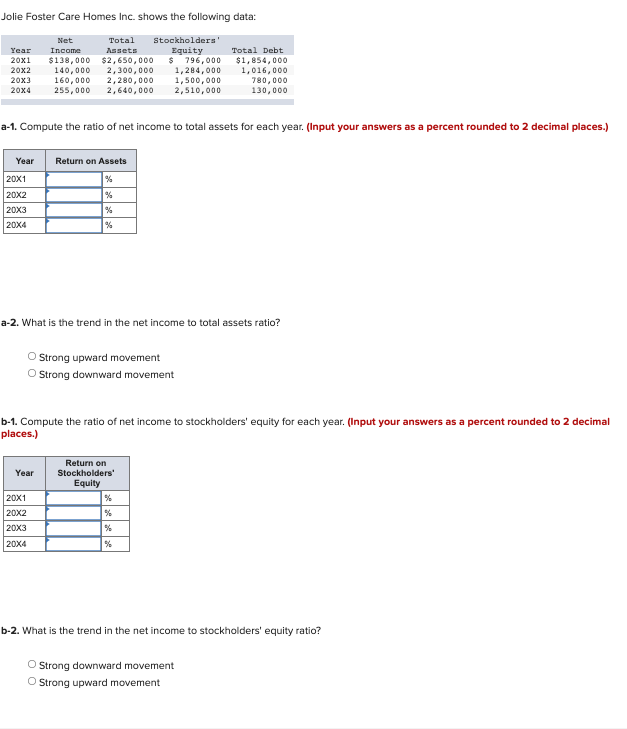
Jolie Foster Care Homes Inc. shows the following data: Year Net Income Total Assets Stockholders' Equity Total Debt 20X1 $ 138,000 $ 2,650,000 $ 796,000

Jolie Foster Care Homes Inc. shows the following data:
| Year | Net Income | Total Assets | Stockholders' Equity | Total Debt | ||||
| 20X1 | $ | 138,000 | $ | 2,650,000 | $ | 796,000 | $ | 1,854,000 |
| 20X2 | 140,000 | 2,300,000 | 1,284,000 | 1,016,000 | ||||
| 20X3 | 160,000 | 2,280,000 | 1,500,000 | 780,000 | ||||
| 20X4 | 255,000 | 2,640,000 | 2,510,000 | 130,000 | ||||
a-1. Compute the ratio of net income to total assets for each year. (Input your answers as a percent rounded to 2 decimal places.)
a-2. What is the trend in the net income to total assets ratio?
-
Strong upward movement
-
Strong downward movement
b-1. Compute the ratio of net income to stockholders' equity for each year. (Input your answers as a percent rounded to 2 decimal places.)
b-2. What is the trend in the net income to stockholders' equity ratio?
-
Strong downward movement
-
Strong upward movement
Step by Step Solution
There are 3 Steps involved in it
Step: 1

Get Instant Access to Expert-Tailored Solutions
See step-by-step solutions with expert insights and AI powered tools for academic success
Step: 2

Step: 3

Ace Your Homework with AI
Get the answers you need in no time with our AI-driven, step-by-step assistance
Get Started


