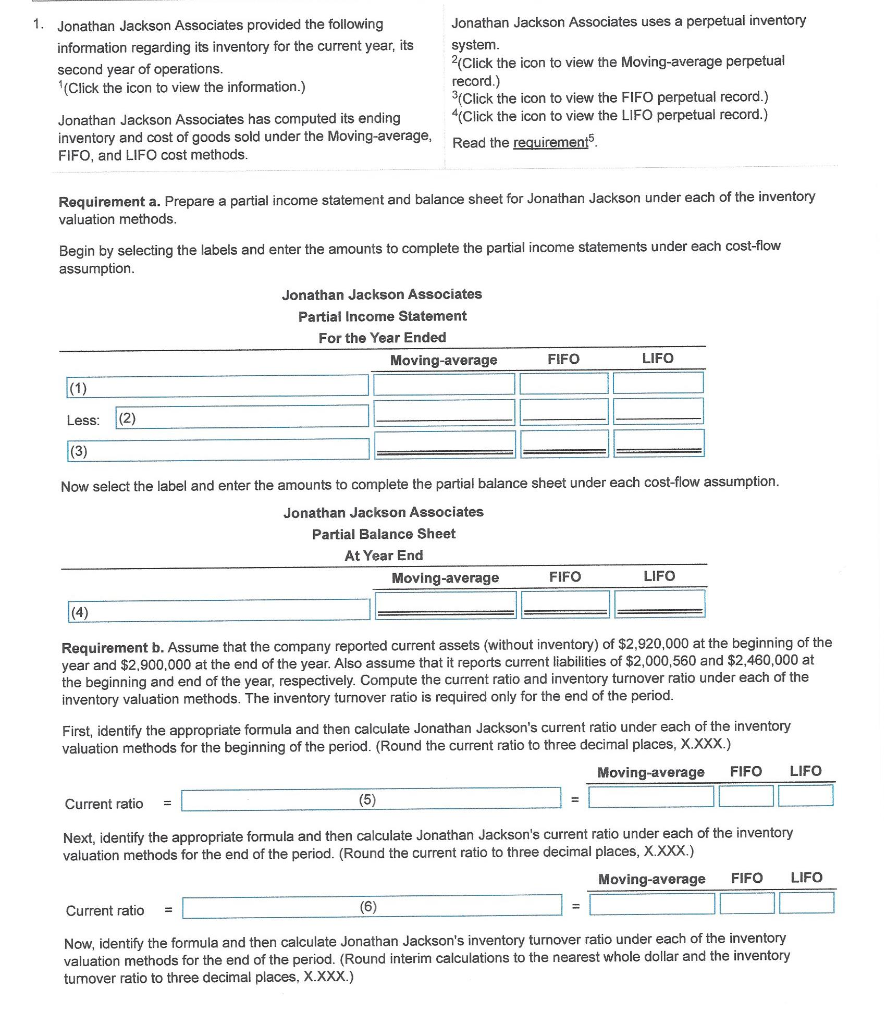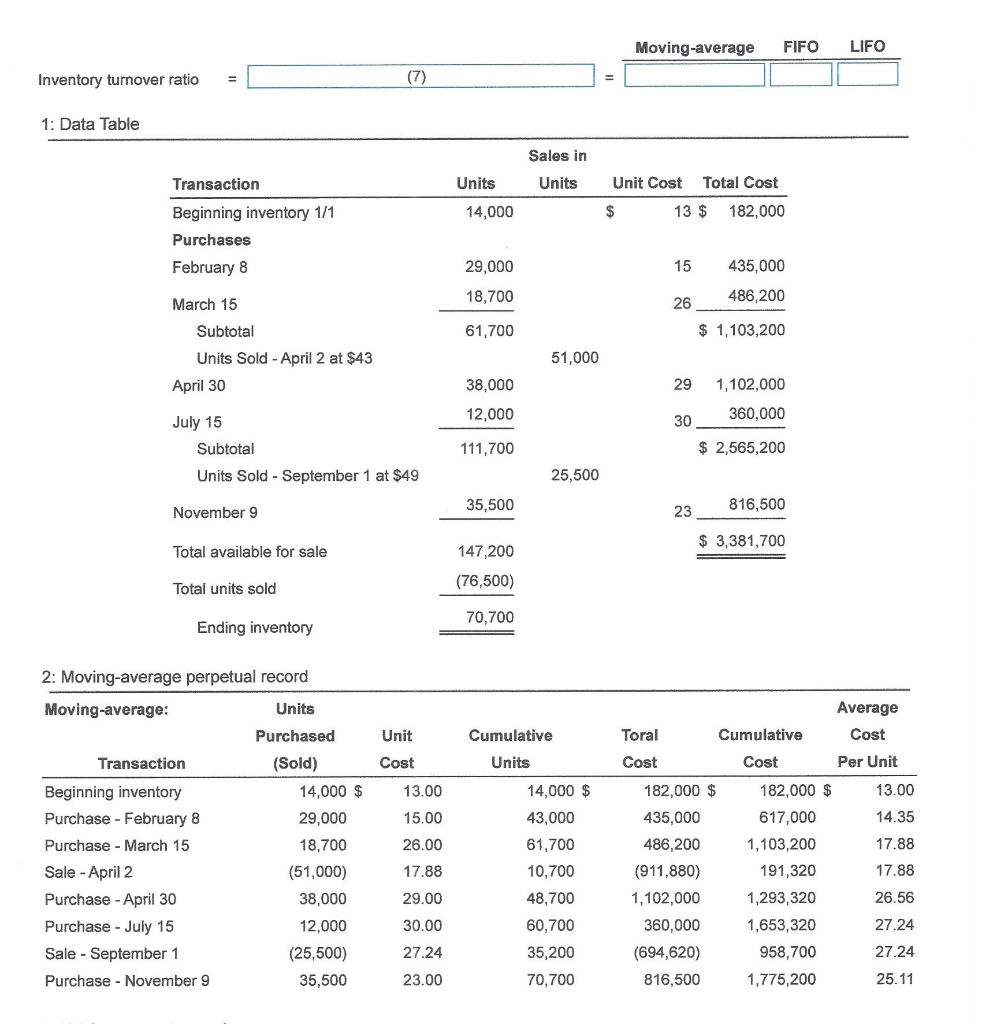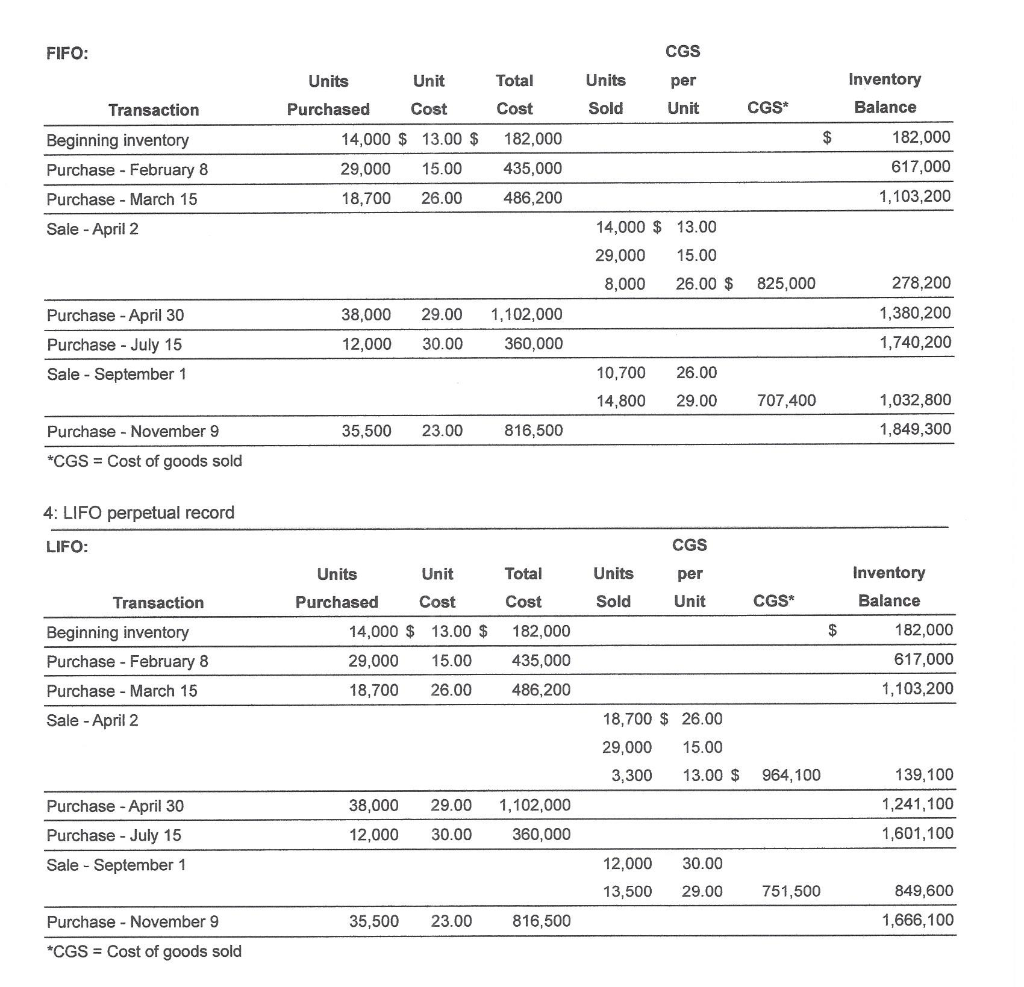


Jonathan Jackson Associates uses a perpetual inventory 1. Jonathan Jackson Associates provided the following information regarding its inventory for the current year, its system. 2(Click the icon to view the Moving-average perpetual record.) 3(Click the icon to view the FIFO perpetual record.) 4(Click the icon to view the LIFO perpetual record.) second year of operations. (Click the icon to view the information.) Jonathan Jackson Associates has computed its ending inventory and cost of goods sold under the Moving-average, FIFO, and LIFO cost methods. Read the requirement5. Requirement a. Prepare a partial income statement and balance sheet for Jonathan Jackson under each of the inventory valuation methods. Begin by selecting the labels and enter the amounts to complete the partial income statements under each cost-flow assumption Jonathan Jackson Associates Partial Income Statement For the Year Ended FIFO LIFO Moving-average (1) |(2) Less: (3) Now select the label and enter the amounts to complete the partial balance sheet under each cost-flow assumption. Jonathan Jackson Associates Partial Balance Sheet At Year End LIFO FIFO Moving-average (4) Requirement b. Assume that the company reported current assets (without inventory) of $2,920,000 at the beginning of the year and $2,900,000 at the end of the year. Also assume that it reports current liabilities of $2,000,560 and $2,460,000 at the beginning and end of the year, respectively. Compute the current ratio and inventory turnover ratio under each of the inventory valuation methods. The inventory turnover ratio is required only for the end of the period. First, identify the appropriate formula and then calculate Jonathan Jackson's current ratio under each of the inventory valuation methods for the beginning of the period. (Round the current ratio to three decimal places, X.XXX.) LIFO Moving-average FIFO (5) = Current ratio - Next, identify the appropriate formula and then calculate Jonathan Jackson's current ratio under each of the inventory valuation methods for the end of the period. (Round the current ratio to three decimal places, X.XXX.) FIFO LIFO Moving-average (6) Current ratio - Now, identify the formula and then calculate Jonathan Jackson's inventory turnover ratio under each of the inventory valuation methods for the end of the period. (Round interim calculations to the nearest whole dollar and the inventory tunover ratio to three decimal places, X.XXX.) FIFO LIFO Moving-average (7) Inventory turnover ratio 1: Data Table Sales in Total Cost Unit Cost Units Units Transaction 14,000 $ 13 182,000 Beginning inventory 1/1 Purchases 435,000 29,000 15 February 8 486,200 18,700 26 March 15 $1,103,200 Subtotal 61,700 51,000 Units Sold April 2 at $43 38,000 29 1,102,000 April 30 360,000 12,000 30 July 15 $2,565,200 111,700 Subtotal Units Sold September 1 at $49 25,500 816,500 35,500 23 November 9 3,381,700 Total available for sale 147,200 (76,500) Total units sold 70,700 Ending inventory 2: Moving-average perpetual record Average Moving-average: Units Cost Purchased Unit Cumulative Toral Cumulative Per Unit Cost Units Cost Cost (Sold) Transaction 14,000 $ 182,000 $ 182,000 $ 13.00 14,000 $ 13.00 Beginning inventory 617,000 Purchase February 8 435,000 14.35 29,000 15.00 43,000 18,700 17.88 61,700 486,200 1,103,200 Purchase March 15 26.00 17.88 17.88 10,700 (911,880) 191,320 Sale April 2 (51,000) 1,102,000 38,000 29.00 48,700 1,293,320 26.56 Purchase -April 30 360,000 30.00 60,700 1,653,320 27.24 Purchase July 15 12,000 (25,500) 35,200 27.24 (694,620) 958,700 Sale September 1 27.24 Purchase November 9 70,700 816,500 1,775,200 25.11 35,500 23.00 CGS FIFO: Inventory Unit Total Units Units per CGS* Sold Unit Balance Cost Cost Transaction Purchased 14,000 13.00 $ 182,000 182,000 Beginning inventory 617,000 435,000 29,000 15.00 Purchase - February 8 1,103,200 486,200 18,700 26.00 Purchase - March 15 13.00 14,000 $ Sale April 2 29,000 15.00 26.00 $ 278,200 8,000 825,000 1,380,200 38,000 29.00 1,102,000 Purchase -April 30 1,740,200 30.00 360,000 Purchase - July 15 12,000 Sale September 1 26.00 10,700 14,800 29.00 707,400 1,032,800 1,849,300 Purchase November 9 35,500 23.00 816,500 *CGS Cost of goods sold 4: LIFO perpetual record CGS LIFO: Total Units Inventory Units Unit per Sold Unit CGS* Balance Cost Cost Purchased Transaction 182,000 14,000 $ 13.00 $ 182,000 $ Beginning inventory 617,000 Purchase February 8 29,000 15.00 435,000 1,103,200 26.00 486,200 Purchase-March 15 18,700 18,700 26.00 Sale -April 2 29,000 15.00 13.00 $ 139,100 3,300 964,100 1,241,100 Purchase -April 30 38,000 29.00 1,102,000 1,601,100 12,000 30.00 360,000 Purchase July 15 12,000 30.00 Sale September 1 751,500 13,500 29.00 849,600 Purchase November 9 1,666,100 35,500 816,500 23.00 *CGS Cost of goods sold


