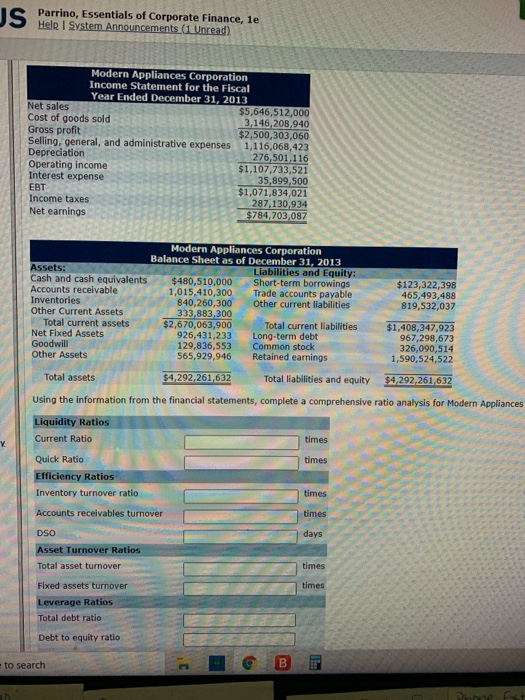
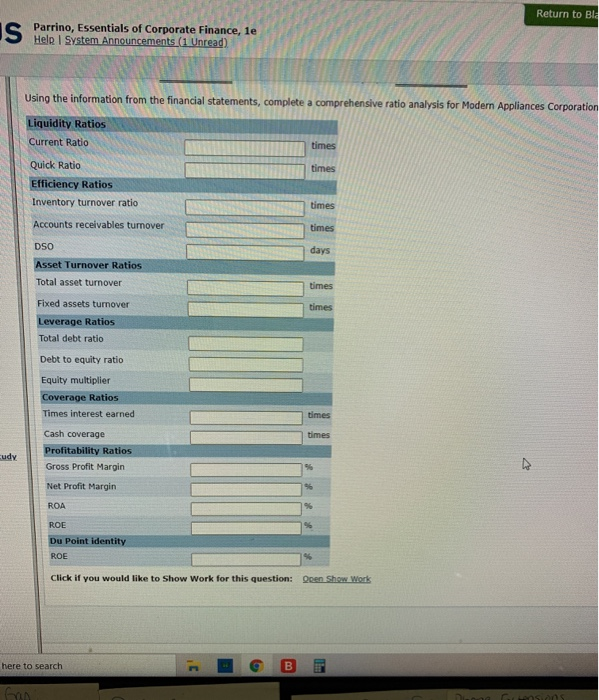
JS Parrino, Essentials of Corporate Finance, le Help System Announcements (1 Unread) Modern Appliances Corporation Income Statement for the Fiscal Year Ended December 31, 2013 Net sales $5,646,512,000 Cost of goods sold 3,146,208,940 Gross profit $2,500,303,060 Selling, general, and administrative expenses 1,116,068,423 Depreciation 276,501,116 Operating income $1,107,733,521 Interest expense 35,899,500 EBT $1,071,834,021 Income taxes 287,130,934 Net earnings $784,703,087 Modern Appliances Corporation Balance Sheet as of December 31, 2013 Assets: Liabilities and Equity: Cash and cash equivalents $480,510,000 Short-term borrowings Accounts receivable 1,015,410,300 Trade accounts payable Inventories 840,260,300 Other current liabilities Other Current Assets 333,883,300 Total current assets $2,670,063,900 Total current liabilities Net Fixed Assets 926,431,233 Long-term debt Goodwill 129,836,553 Common stock Other Assets 565,929,946 Retained earnings $123,322,398 465,493,488 819,532,037 $1,408,347,923 967,298,673 326,090,514 1,590,524,522 Total assets $4,292.261,632 Total liabilities and equity $4,292,261,632 Using the information from the financial statements, complete a comprehensive ratio analysis for Modern Appliances Liquidity Ratios Current Ratio times times Quick Ratio Efficiency Ratios Inventory turnover ratio times Accounts receivables turnover times DSO days Asset Turnover Ratios Total asset turnover times times Fixed assets turnover Leverage Ratios Total debt ratio Debt to equity ratio to search B Phone Ext Return to BL IS Parrino, Essentials of Corporate Finance, le Help System Announcements (Unread) Using the information from the financial statements, complete a comprehensive ratio analysis for Modern Appliances Corporation Liquidity Ratios Current Ratio times times Quick Ratio Efficiency Ratios Inventory turnover ratio times Accounts receivables turnover times days times DSO Asset Turnover Ratios Total asset turnover Fixed assets turnover Leverage Ratios Total debt ratio times Debt to equity ratio Equity multiplier Coverage Ratios Times interest earned times times Cash coverage Profitability Ratios Gross Profit Margin cudy V 96 Net Profit Margin ROA 96 ROE Du Point identity ROE Click if you would like to Show Work for this question: Open Show Work here to search B C GD


