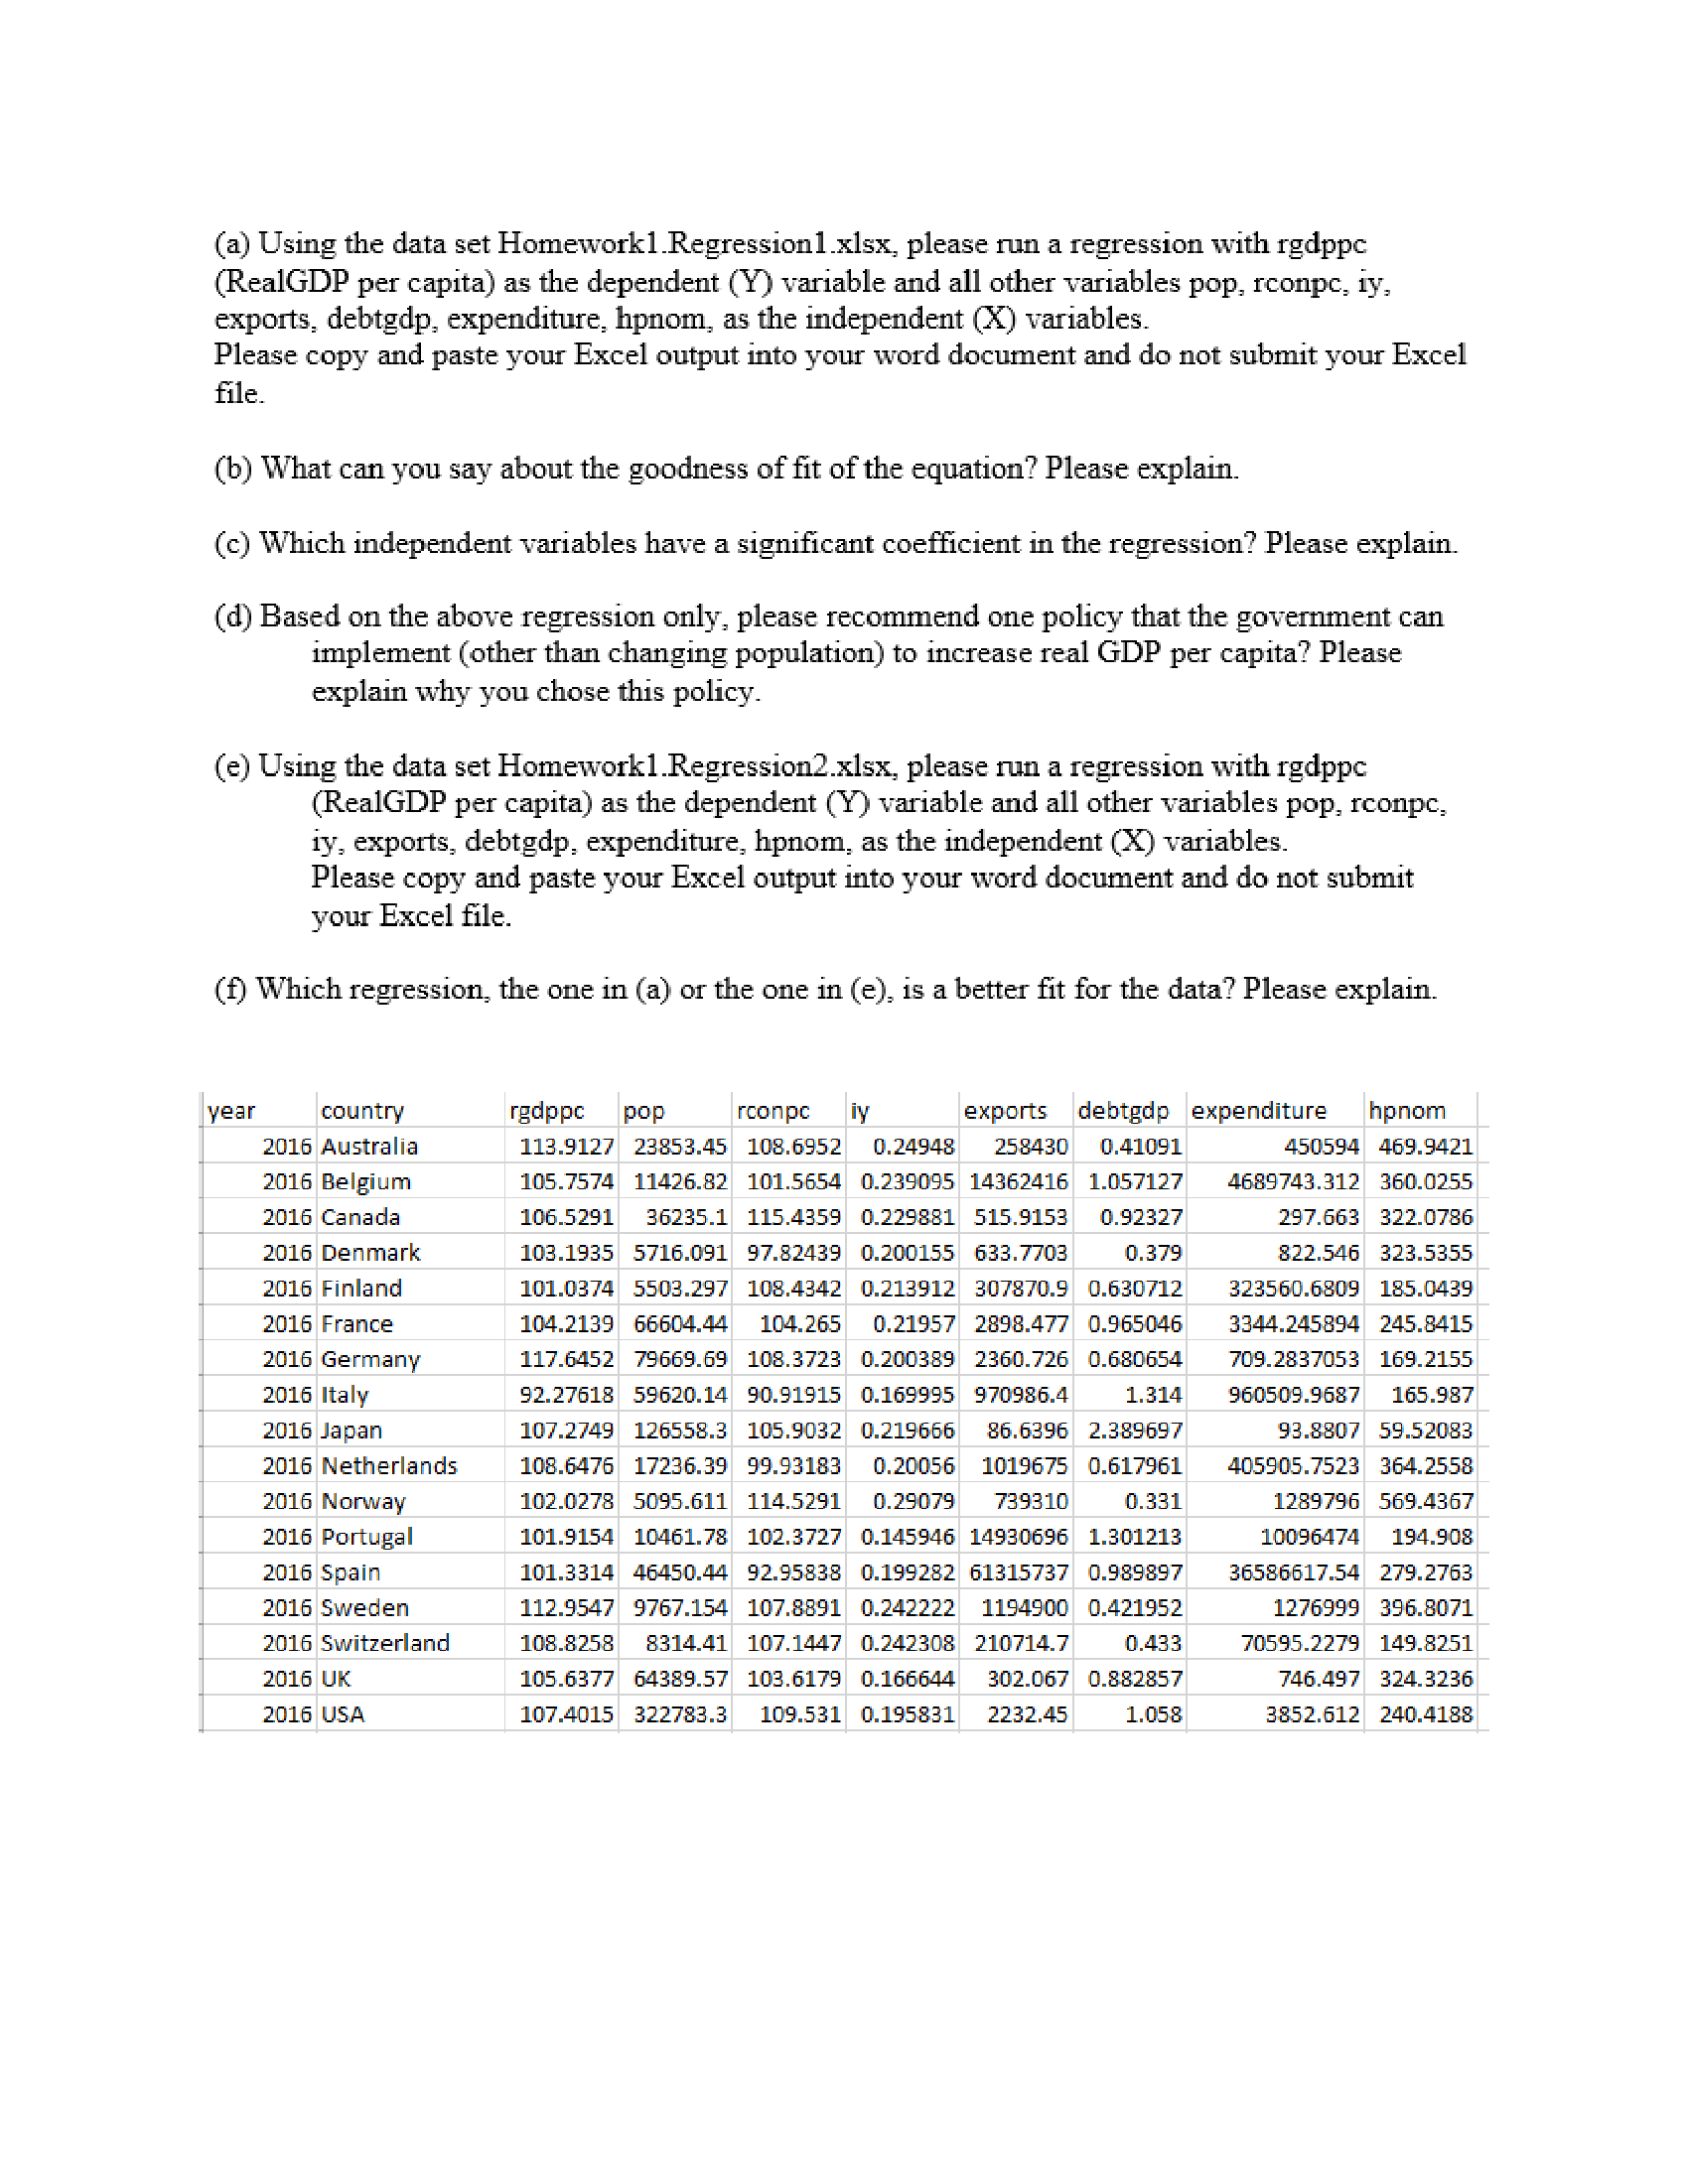
jstdatasetr4_csv is the attached picture and jstdatasetr4_csv is below
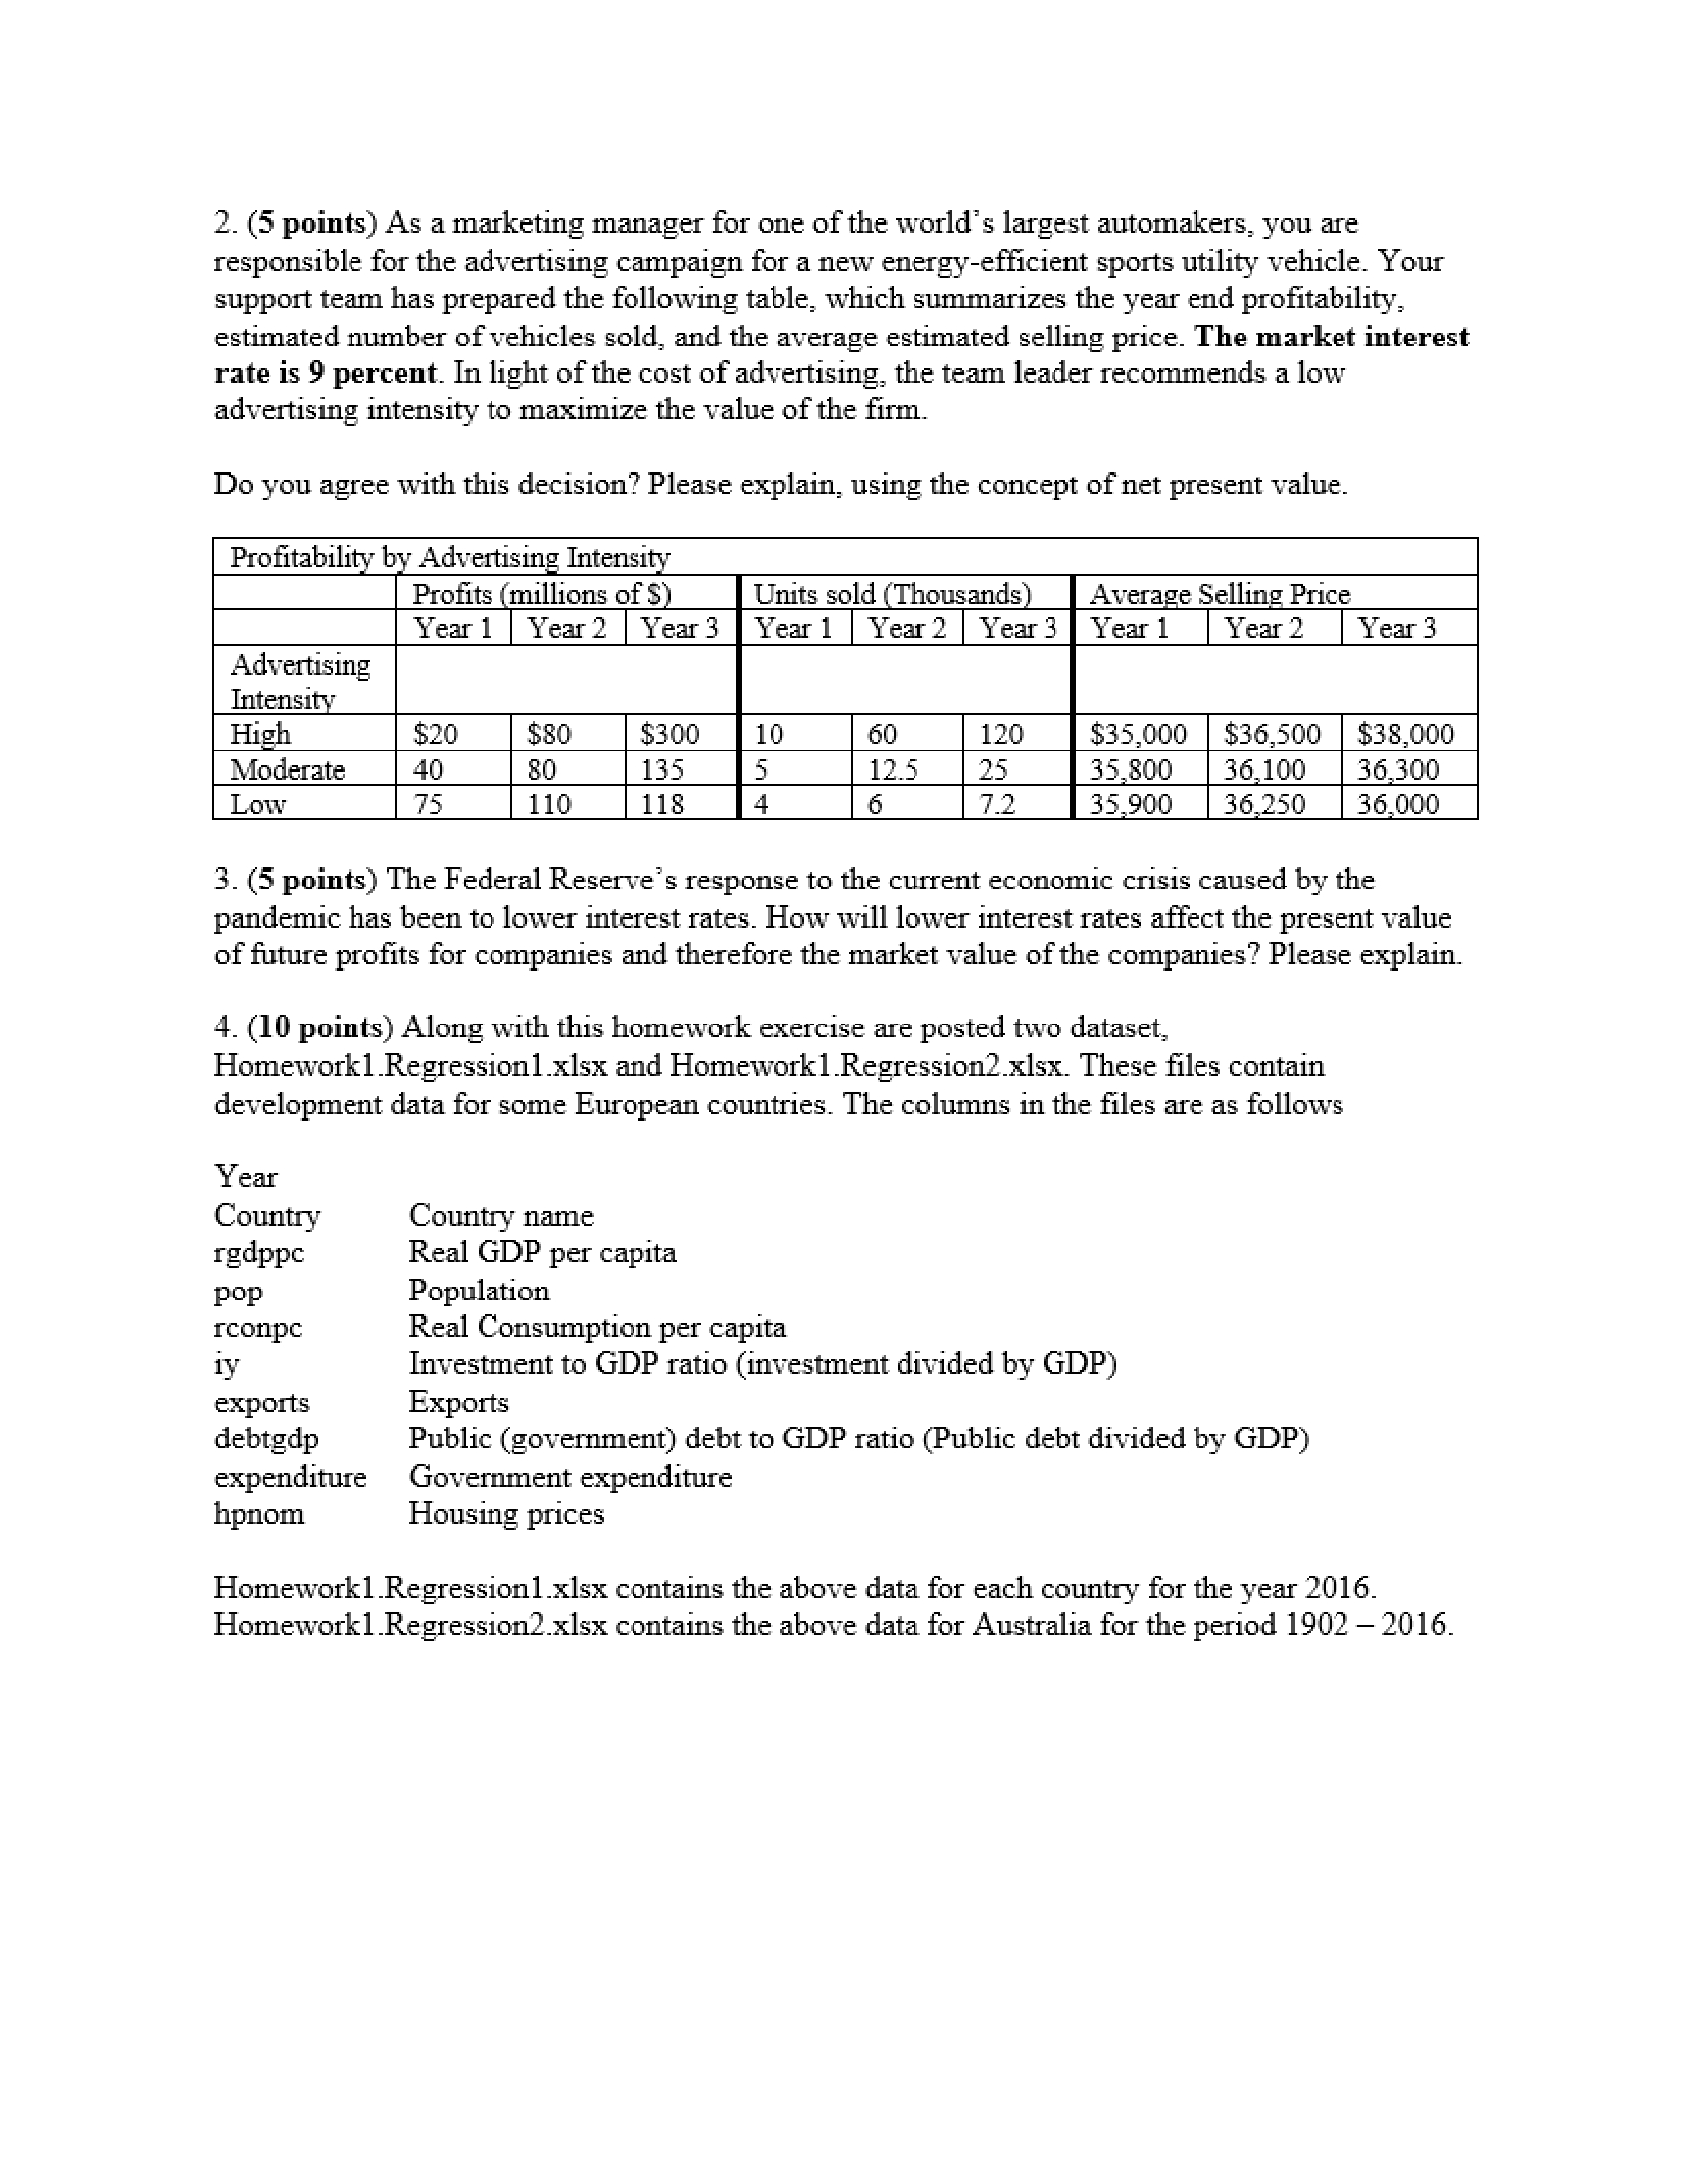
2. (5 points) As a marketing manager for one of the world's largest automakers, you are responsible for the advertising campaign for a new energy-efficient sports utility vehicle. Your support team has prepared the following table, which summarizes the year end profitability. estimated number of vehicles sold, and the average estimated selling price. The market interest rate is 9 percent. In light of the cost of advertising, the team leader recommends a low advertising intensity to maximize the value of the firm. Do you agree with this decision? Please explain, using the concept of net present value. Profitability by Advertising Intensity Profits (millions of $) Units sold (Thousands) Average Selling Price Year 1 Year 2 Year 3 Year 1 Year 2 Year 3 Year 1 Year 2 Year 3 Advertising Intensity High $20 $80 $300 10 60 120 $35,000 $36,500 $38,000 Moderate 40 80 135 5 12.5 25 35,800 36,100 36,300 Low 75 110 118 4 6 7.2 35,900 36,250 36,000 3. (5 points) The Federal Reserve's response to the current economic crisis caused by the pandemic has been to lower interest rates. How will lower interest rates affect the present value of future profits for companies and therefore the market value of the companies? Please explain. 4. (10 points) Along with this homework exercise are posted two dataset, Homework1. Regression1.xlex and Homework1.Regression2.xlsx. These files contain development data for some European countries. The columns in the files are as follows Year Country Country name rgappc Real GDP per capita pop Population rconpc Real Consumption per capita 1y Investment to GDP ratio (investment divided by GDP) exports Exports debtgap Public (government) debt to GDP ratio (Public debt divided by GDP) expenditure Government expenditure hpnom Housing prices Homework1.Regression1.xlsx contains the above data for each country for the year 2016. Homework1.Regression2.xlex contains the above data for Australia for the period 1902 - 2016.(a) Using the data set Homework1. Regression1.xlsx, please run a regression with redppc (RealGDP per capita) as the dependent (Y) variable and all other variables pop, rconpc, iy, exports, debtgap, expenditure, hpnom, as the independent (X) variables. Please copy and paste your Excel output into your word document and do not submit your Excel file. (b) What can you say about the goodness of fit of the equation? Please explain. (c) Which independent variables have a significant coefficient in the regression? Please explain. (d) Based on the above regression only, please recommend one policy that the government can implement (other than changing population) to increase real GDP per capita? Please explain why you chose this policy. (e) Using the data set Homework1. Regression2.xlsx, please run a regression with redppc (RealGDP per capita) as the dependent (Y) variable and all other variables pop, rconpc. iy, exports, debtgap, expenditure, hpnom, as the independent (X) variables. Please copy and paste your Excel output into your word document and do not submit your Excel file. (f) Which regression, the one in (a) or the one in (e). is a better fit for the data? Please explain. year country rgdppc pop rconpc iy exports debtgdp expenditure hpnom 2016 Australia 113.9127 23853.45 108.6952 0.24948 258430 0.41091 450594 469.9421 2016 Belgium 105.7574 11426.82 101.5654 0.239095 14362416 1.057127 4689743.312 360.0255 2016 Canada 106.5291 36235.1 115.4359 0.229881 515.9153 0.92327 297.663 322.0786 2016 Denmark 103.1935 5716.091 97.82439 0.200155 633.7703 0.379 822.546 323.5355 2016 Finland 101.0374 5503.297 108.4342 0.213912 307870.9 0.630712 323560.6809 185.0439 2016 France 104.2139 66604.44 104.265 0.21957 2898.477 0.965046 3344.245894 245.8415 2016 Germany 117.6452 79669.69 108.3723 0.200389 2360.726 0.680654 709.2837053 169.2155 2016 Italy 92.27618 59620.14 90.91915 0.169995 970986.4 1.314 960509.9687 165.987 2016 Japan 107.2749 126558.3 105.9032 0.219666 86.6396 2.389697 93.8807 59.52083 2016 Netherlands 108.6476 17236.39 99.93183 0.20056 1019675 0.617961 405905.7523 364.2558 2016 Norway 102.0278 5095.611 114.5291 0.29079 739310 0.331 1289796 569.4367 2016 Portugal 101.9154 10461.78 102.3727 0.145946 14930696 1.301213 10096474 194.908 2016 Spain 101.3314 46450.44 92.95838 0.199282 61315737 0.989897 36586617.54 279.2763 2016 Sweden 112.9547 9767.154 107.8891 0.242222 1194900 0.421952 1276999 396.8071 2016 Switzerland 108.8258 8314.41 107.1447 0.242308 210714.7 0.433 70595.2279 149.8251 2016 UK 105.6377 64389.57 103.6179 0.166644 302.067 0.882857 746.497 324.3236 2016 USA 107.4015 322783.3 109.531 0.195831 2232.45 1.058 3852.612 240.4188


