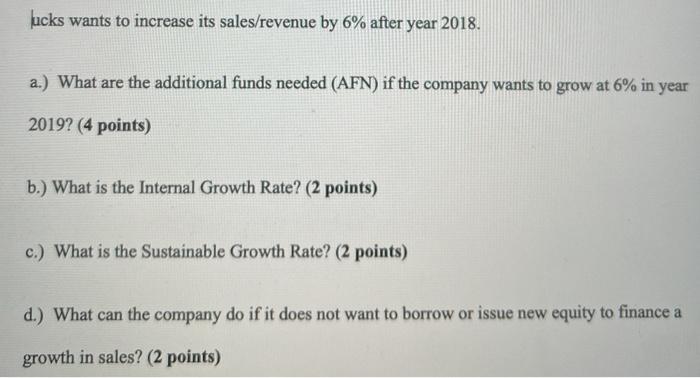
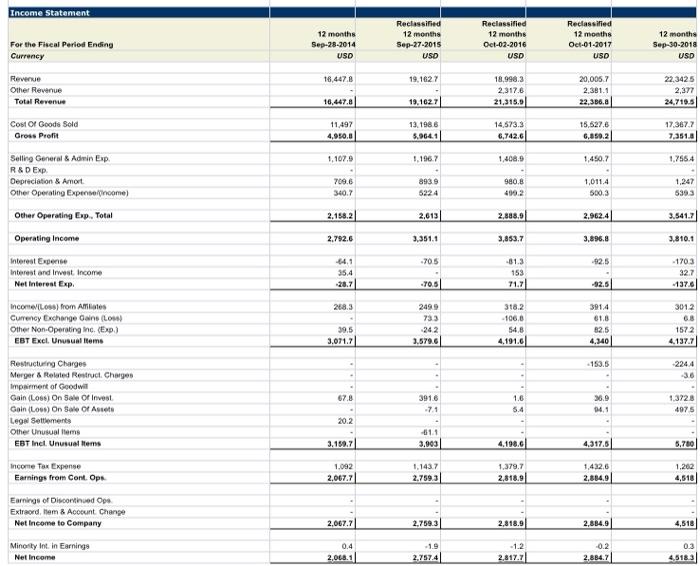
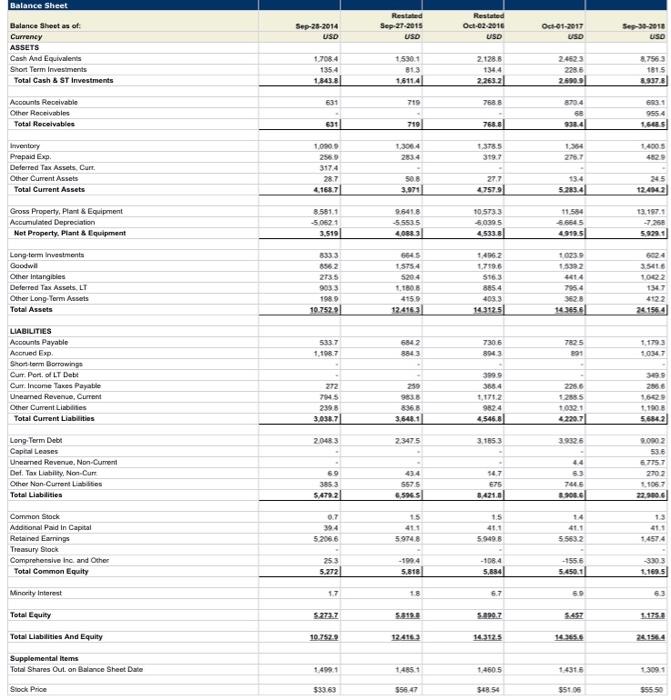
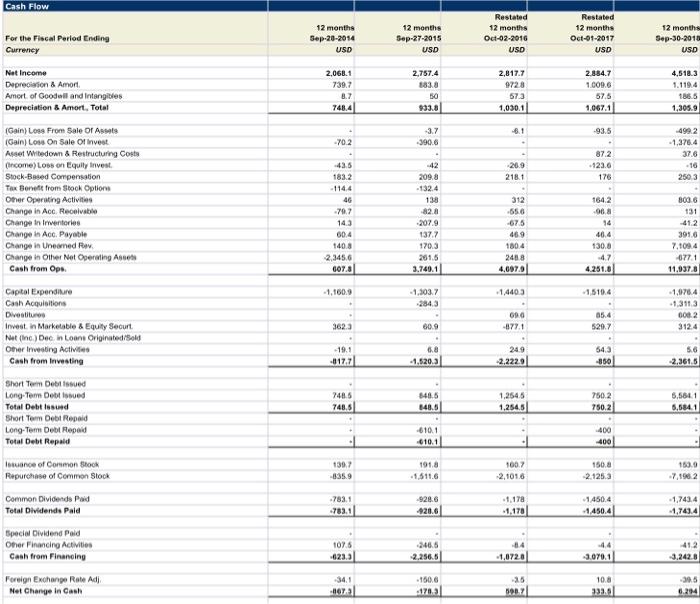
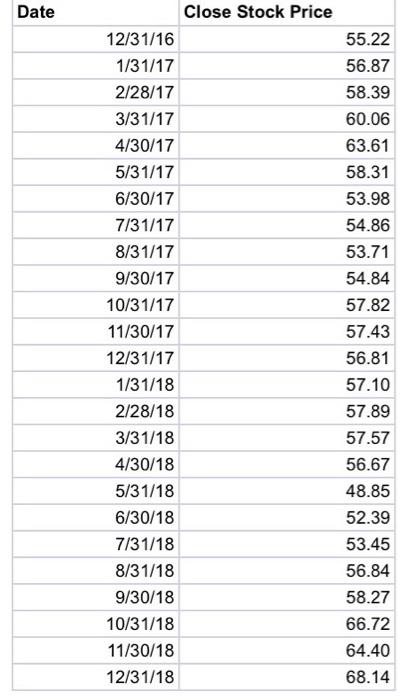
Jucks wants to increase its sales/revenue by 6% after year 2018. a.) What are the additional funds needed (AFN) if the company wants to grow at 6% in year 2019? (4 points) b.) What is the Internal Growth Rate? (2 points) c.) What is the Sustainable Growth Rate? (2 points) d.) What can the company do if it does not want to borrow or issue new equity to finance a growth in sales? (2 points) Income Statement 12 months Sep-28-2014 Reclassified 12 months Sep-27-2015 USD For the Fiscal Period Ending Currency Reclassified 12 months Oct-02-2016 USD Reclassified 12 months Oct-01-2017 USD 12 months Sep-30-2018 USD USD 16,447.8 19,1627 Revenue Other Revenue Total Revenue 18,998.3 2.317.6 21,315.0 20,0057 2.381.1 22,386.8 22.3425 2,377 24.719.5 16,447.81 19.102.7 Cost Of Gooda Sold Gross Profit 11497 4,950.0 13.1986 5.964.1 14,573,3 6.742.6 15.627.6 G.850.2 17.367.7 7.351.0 1,107.9 1.1967 1,450.7 1.7564 Selling General & Admin Exp R&D Exp Depreciation & Amort Other Operating Expertencome) 709.6 8939 5224 980.8 4992 1,011.4 5003 1,247 5393 340.7 Other Operating Exp. Total 2.158.2 2.888.0 2.962.4 3.541.7 Operating Income 2.782.6 3,351.1 3,853.7 3,096.8 3.810.1 .705 92.5 Interest Expense Interest and west Income Net Interest Exp -64.1 35.4 -81.3 153 71.7 - 1703 32.7 -1376 T0.5 268.3 Income Los) from Ames Currency Exchange Cans (Low Other Non-Operating Inc. (Exp) EBT Excl. Unusual Items 2499 733 242 3.579.6 39.5 3.071.71 318.2 -106.8 548 4.191.01 391.4 61.8 12.5 4.340 3012 68 1572 4.1377 224.4 -36 67.8 Restructuring Charges Merger & Related Restruct. Charger Impairment of Goodwin Gain (Loss) On Sale Of Invest Goin (Los) On Sale Of Assets Lega Settlements Other Unusual tema EBT Incl. Unusual Items 391.6 -71 1.6 5.4 3.9 04.1 1.3728 4975 20.2 -61.1 3.903 3.150.7 4,198.6 4.317.8 5.780 Income Tax Expense Earnings from Cont. Op 1.092 2.067.7 1.1437 2.7593 1,379.7 2,818.9 1.432.6 2.884,9 1,202 4,518 Earnings of Discontinued Op Extraord, mam 8 Account Change Net Income to Company 2.067.7 2.759.3 2.818.9 2,884.9 4,518 0.3 Minority Int. In Earnings Net Income 0.4 2.068.1 -1.9 2.757.4 - 1.2 2.817.7 -0.2 2.884.7 4.5183 Balance Sheet Sep-28-2014 USD Restated Sep-27-2015 USD Restated Oct-02-2010 USD Oct-01-2017 USD Sep-3-2010 USD Balance Sheet as of Currency ASSETS Cash And Equivalents Short Term Investments Total Cash & ST Investments 1.7084 135.4 1.3438 1.530.1 13 1.6114 2.1288 134.4 2.263.2 24623 2285 2.6909 8.7563 1815 89078 631 719 7688 Accounts Receivable Other Receivables Total Receivables 8704 50 6831 9554 1,60S 631 710 1,3064 1.378.5 319.7 1354 21.7 Prepaid Exp. Deferred Tax Assets Curr Other Current Assets Total Current Assets 1.000 256 317.4 28.7 4.168.7 50.8 3.971 27.7 47579 134 5.283.41 124142 Gross Property, Plant & Equipment Accumulated Depreciation Not Property. Plant & Equipment 8.561.1 -50621 3,519 9.6418 -5.5535 4,0883 10.5733 50395 4,533.8) 11.584 56545 49195 13.1970 -7.250 5.9291 8562 273,5 6645 1575.4 5204 1.180,8 4159 12.4163 1436.2 1719.6 5163 885.4 4033 143125 1023 13322 4414 7954 3628 143656 3.54416 10022 147 4122 261564 10.752 Long-term investments Goodwill Other Intangibles Deferred Tax Assets, LT Other Long Term Assets Total Assets LIABILITIES Accounts Payable Accrued Exp Short term Borrowingo Curr. Port of LT Debt Curr. Income Taxes Payable Unearned Revenue, Current Other Current Liabilities Total Current Liabilities 7825 5337 1,108.7 6842 8843 7306 8043 1.1793 1057 250 272 784.5 2398 3.038.7 399. 368.4 1,1712 9824 4,546.8 2256 1.288.5 10321 42207 34 2856 1.6520 1.1908 5.6542 8368 3.643.1 20483 2.347.5 3.1853 3.9326 Long-Term Debt Capital Leases Unearned Revenue, Non-Current Def. Tax Liability. Non-Cum Other Non Current Liabities Total Liabilities 90002 536 6.7757 2702 - 69 3853 54712 43:4 557.5 6.596.5 14.7 675 3421.0 63 765 8.9066 22.000 6 1.5 0.7 39.4 5.2006 1.5 41.1 5949 13 411 411 5.5632 5.9748 1.4574 Common Stock Additional Paid in Capital Retained Earnings Treasury Shock Comprehensive Inc and Other Total Common Equity 25.3 5.272 -1994 5.818 -1084 5,884 -3803 116.5 5.450.1 Minority Interest 17 18 6.7 5. Total Equity 5.273.7 5.319.0 5.490.7 1.175.0 Total Liabilities And Equity 10.752 124162 14.3125 143656 Supplemental Items Total Shares Out on Balance Sheet Date 14851 14605 1.3091 Stock Price $33.63 $5647 SEB 54 5518 55550 Cash Flow For the Fiscal Period Ending Currency 12 months Sep-20-2014 USD 12 months Sep-27-2015 USD Restated 12 months Oct-02-2016 USD Restated 12 months Oct-01-2017 USD 12 months Sep-30-2014 USD Net Income Depreciation & Amort Amort of Goodall and intangibles Depreciation & Amort. Total 2,068.1 739.7 8.7 748.4 2,757.4 883.8 50 933.8 2,817.7 9728 573 1,030.1 2.884.7 1.609.6 57,5 1.067.1 4,518.3 1.1194 1855 1,305.9 -6.1 -93.5 3.7 390.6 -70.2 4992 - 1,376.4 37.6 -16 250 3 872 -923.6 176 26.9 218.1 (Gain) Loss From Sale or Armats Gain) Loss On Sale Of invest Asset Witedown & Restructuring Costs income) Lowon Equity Invest Stock-Based Compensation Tax Benefit from stock Option Other Operating Activities Change in Acc. Receivable Change in Irwertories Change in Aon. Payable Change in Unowned Change in Other Net Operating Assets Cash from Ops. 43.5 183.2 - 114.4 46 -707 312 42 209.8 -1324 138 82.8 207.9 1377 170.3 2015 3.749.1 00.4 1408 2.3456 607.5 -656 -675 469 180.4 248.8 4,0979 1642 .06. 94 40.4 130,0 -47 4.251.0 8036 131 412 3916 7,109.4 -677.1 11.937.8 - 1,160.0 1,4403 -1510.4 -1,075.4 -1.3037 284.3 Capital Expenditure Cash Acquisitions Divestito Invest in Marketable & Equity Securt Net (Inc.) Decin Loone Originated/Sold Omer Investing Activities Cash from investing 05.4 5297 090 -877.1 0002 3124 362,3 60.9 19.1 .817.21 0.8 -1.520.3 249 -2.222.9 54.3 -850 56 2,361.5 840.5 7485 748.6 1,2545 1.254.5 Short Term Deblued Long-Term Dobrowed Total Debt losed Short Term Debt Repaid Long-Term Debt Repaid Total Debt Repaid 7502 750.2 6,5641 5,584.1 -6101 010.1 400 400 139.7 1539 Issuance of Conimon Stock Repurchase of Common Stock 1918 -1.511.6 1007 2,101.6 150.0 2.125.3 Common Dividende Pad Total Dividends Paid -7831 -783.11 928.6 -920.6 -1.173 - 1.170 -14504 -1450.4 1,743.4 -1,7434 Special Dividend Paid Omer Financing Activities Cash from Financing 1075 -623.3 246,5 -2.256.5 -4.4 3.070.1 41.2 3.2428 1,0720 Foreign Exchange Rate Adi Net Change In Cash 34.1 467 -1506 -178.3 10.8 333.0 -30.5 6.294 1987 Date Close Stock Price 12/31/16 1/31/17 2/28/17 3/31/17 4/30/17 5/31/17 6/30/17 7/31/17 8/31/17 9/30/17 10/31/17 11/30/17 12/31/17 1/31/18 2/28/18 3/31/18 4/30/18 5/31/18 6/30/18 7/31/18 8/31/18 9/30/18 10/31/18 11/30/18 12/31/18 55.22 56.87 58.39 60.06 63.61 58.31 53.98 54.86 53.71 54.84 57.82 57.43 56.81 57.10 57.89 57.57 56.67 48.85 52.39 53.45 56.84 58.27 66.72 64.40 68.14 Jucks wants to increase its sales/revenue by 6% after year 2018. a.) What are the additional funds needed (AFN) if the company wants to grow at 6% in year 2019? (4 points) b.) What is the Internal Growth Rate? (2 points) c.) What is the Sustainable Growth Rate? (2 points) d.) What can the company do if it does not want to borrow or issue new equity to finance a growth in sales? (2 points) Income Statement 12 months Sep-28-2014 Reclassified 12 months Sep-27-2015 USD For the Fiscal Period Ending Currency Reclassified 12 months Oct-02-2016 USD Reclassified 12 months Oct-01-2017 USD 12 months Sep-30-2018 USD USD 16,447.8 19,1627 Revenue Other Revenue Total Revenue 18,998.3 2.317.6 21,315.0 20,0057 2.381.1 22,386.8 22.3425 2,377 24.719.5 16,447.81 19.102.7 Cost Of Gooda Sold Gross Profit 11497 4,950.0 13.1986 5.964.1 14,573,3 6.742.6 15.627.6 G.850.2 17.367.7 7.351.0 1,107.9 1.1967 1,450.7 1.7564 Selling General & Admin Exp R&D Exp Depreciation & Amort Other Operating Expertencome) 709.6 8939 5224 980.8 4992 1,011.4 5003 1,247 5393 340.7 Other Operating Exp. Total 2.158.2 2.888.0 2.962.4 3.541.7 Operating Income 2.782.6 3,351.1 3,853.7 3,096.8 3.810.1 .705 92.5 Interest Expense Interest and west Income Net Interest Exp -64.1 35.4 -81.3 153 71.7 - 1703 32.7 -1376 T0.5 268.3 Income Los) from Ames Currency Exchange Cans (Low Other Non-Operating Inc. (Exp) EBT Excl. Unusual Items 2499 733 242 3.579.6 39.5 3.071.71 318.2 -106.8 548 4.191.01 391.4 61.8 12.5 4.340 3012 68 1572 4.1377 224.4 -36 67.8 Restructuring Charges Merger & Related Restruct. Charger Impairment of Goodwin Gain (Loss) On Sale Of Invest Goin (Los) On Sale Of Assets Lega Settlements Other Unusual tema EBT Incl. Unusual Items 391.6 -71 1.6 5.4 3.9 04.1 1.3728 4975 20.2 -61.1 3.903 3.150.7 4,198.6 4.317.8 5.780 Income Tax Expense Earnings from Cont. Op 1.092 2.067.7 1.1437 2.7593 1,379.7 2,818.9 1.432.6 2.884,9 1,202 4,518 Earnings of Discontinued Op Extraord, mam 8 Account Change Net Income to Company 2.067.7 2.759.3 2.818.9 2,884.9 4,518 0.3 Minority Int. In Earnings Net Income 0.4 2.068.1 -1.9 2.757.4 - 1.2 2.817.7 -0.2 2.884.7 4.5183 Balance Sheet Sep-28-2014 USD Restated Sep-27-2015 USD Restated Oct-02-2010 USD Oct-01-2017 USD Sep-3-2010 USD Balance Sheet as of Currency ASSETS Cash And Equivalents Short Term Investments Total Cash & ST Investments 1.7084 135.4 1.3438 1.530.1 13 1.6114 2.1288 134.4 2.263.2 24623 2285 2.6909 8.7563 1815 89078 631 719 7688 Accounts Receivable Other Receivables Total Receivables 8704 50 6831 9554 1,60S 631 710 1,3064 1.378.5 319.7 1354 21.7 Prepaid Exp. Deferred Tax Assets Curr Other Current Assets Total Current Assets 1.000 256 317.4 28.7 4.168.7 50.8 3.971 27.7 47579 134 5.283.41 124142 Gross Property, Plant & Equipment Accumulated Depreciation Not Property. Plant & Equipment 8.561.1 -50621 3,519 9.6418 -5.5535 4,0883 10.5733 50395 4,533.8) 11.584 56545 49195 13.1970 -7.250 5.9291 8562 273,5 6645 1575.4 5204 1.180,8 4159 12.4163 1436.2 1719.6 5163 885.4 4033 143125 1023 13322 4414 7954 3628 143656 3.54416 10022 147 4122 261564 10.752 Long-term investments Goodwill Other Intangibles Deferred Tax Assets, LT Other Long Term Assets Total Assets LIABILITIES Accounts Payable Accrued Exp Short term Borrowingo Curr. Port of LT Debt Curr. Income Taxes Payable Unearned Revenue, Current Other Current Liabilities Total Current Liabilities 7825 5337 1,108.7 6842 8843 7306 8043 1.1793 1057 250 272 784.5 2398 3.038.7 399. 368.4 1,1712 9824 4,546.8 2256 1.288.5 10321 42207 34 2856 1.6520 1.1908 5.6542 8368 3.643.1 20483 2.347.5 3.1853 3.9326 Long-Term Debt Capital Leases Unearned Revenue, Non-Current Def. Tax Liability. Non-Cum Other Non Current Liabities Total Liabilities 90002 536 6.7757 2702 - 69 3853 54712 43:4 557.5 6.596.5 14.7 675 3421.0 63 765 8.9066 22.000 6 1.5 0.7 39.4 5.2006 1.5 41.1 5949 13 411 411 5.5632 5.9748 1.4574 Common Stock Additional Paid in Capital Retained Earnings Treasury Shock Comprehensive Inc and Other Total Common Equity 25.3 5.272 -1994 5.818 -1084 5,884 -3803 116.5 5.450.1 Minority Interest 17 18 6.7 5. Total Equity 5.273.7 5.319.0 5.490.7 1.175.0 Total Liabilities And Equity 10.752 124162 14.3125 143656 Supplemental Items Total Shares Out on Balance Sheet Date 14851 14605 1.3091 Stock Price $33.63 $5647 SEB 54 5518 55550 Cash Flow For the Fiscal Period Ending Currency 12 months Sep-20-2014 USD 12 months Sep-27-2015 USD Restated 12 months Oct-02-2016 USD Restated 12 months Oct-01-2017 USD 12 months Sep-30-2014 USD Net Income Depreciation & Amort Amort of Goodall and intangibles Depreciation & Amort. Total 2,068.1 739.7 8.7 748.4 2,757.4 883.8 50 933.8 2,817.7 9728 573 1,030.1 2.884.7 1.609.6 57,5 1.067.1 4,518.3 1.1194 1855 1,305.9 -6.1 -93.5 3.7 390.6 -70.2 4992 - 1,376.4 37.6 -16 250 3 872 -923.6 176 26.9 218.1 (Gain) Loss From Sale or Armats Gain) Loss On Sale Of invest Asset Witedown & Restructuring Costs income) Lowon Equity Invest Stock-Based Compensation Tax Benefit from stock Option Other Operating Activities Change in Acc. Receivable Change in Irwertories Change in Aon. Payable Change in Unowned Change in Other Net Operating Assets Cash from Ops. 43.5 183.2 - 114.4 46 -707 312 42 209.8 -1324 138 82.8 207.9 1377 170.3 2015 3.749.1 00.4 1408 2.3456 607.5 -656 -675 469 180.4 248.8 4,0979 1642 .06. 94 40.4 130,0 -47 4.251.0 8036 131 412 3916 7,109.4 -677.1 11.937.8 - 1,160.0 1,4403 -1510.4 -1,075.4 -1.3037 284.3 Capital Expenditure Cash Acquisitions Divestito Invest in Marketable & Equity Securt Net (Inc.) Decin Loone Originated/Sold Omer Investing Activities Cash from investing 05.4 5297 090 -877.1 0002 3124 362,3 60.9 19.1 .817.21 0.8 -1.520.3 249 -2.222.9 54.3 -850 56 2,361.5 840.5 7485 748.6 1,2545 1.254.5 Short Term Deblued Long-Term Dobrowed Total Debt losed Short Term Debt Repaid Long-Term Debt Repaid Total Debt Repaid 7502 750.2 6,5641 5,584.1 -6101 010.1 400 400 139.7 1539 Issuance of Conimon Stock Repurchase of Common Stock 1918 -1.511.6 1007 2,101.6 150.0 2.125.3 Common Dividende Pad Total Dividends Paid -7831 -783.11 928.6 -920.6 -1.173 - 1.170 -14504 -1450.4 1,743.4 -1,7434 Special Dividend Paid Omer Financing Activities Cash from Financing 1075 -623.3 246,5 -2.256.5 -4.4 3.070.1 41.2 3.2428 1,0720 Foreign Exchange Rate Adi Net Change In Cash 34.1 467 -1506 -178.3 10.8 333.0 -30.5 6.294 1987 Date Close Stock Price 12/31/16 1/31/17 2/28/17 3/31/17 4/30/17 5/31/17 6/30/17 7/31/17 8/31/17 9/30/17 10/31/17 11/30/17 12/31/17 1/31/18 2/28/18 3/31/18 4/30/18 5/31/18 6/30/18 7/31/18 8/31/18 9/30/18 10/31/18 11/30/18 12/31/18 55.22 56.87 58.39 60.06 63.61 58.31 53.98 54.86 53.71 54.84 57.82 57.43 56.81 57.10 57.89 57.57 56.67 48.85 52.39 53.45 56.84 58.27 66.72 64.40 68.14
