

Question
Julie DeHaan was at it again! It seemed like she made waves wherever she went. At her previous job, which incidentally was also with a
Julie DeHaan was at it again! It seemed like she made waves wherever she went. At her previous job, which incidentally was also with a Fortune 500 company, Julie had successfully implemented a system of evaluating projects based on differential (risk-adjusted) hurdle rates. However, the change caused so much uproar and unpleasantness among divisional heads that Julie knew her days at the job were numbered. Eventually she quit and given her sound credentials had no trouble finding another job.
At her current job as VP of finance for Built-Rite Products Inc., Julie had to evaluate proposals that came in for funding from the firms three product divisions: defense, consumer products, and industrial supply. During her very first month at the job, she was presented with three funding requests, one from each department (see Table 1 for project cost and cash flow projections). Being unclear as to what the policy was regarding the hurdle rate to be used in evaluating such projects, Julie decided to calculate the companys weighted average cost of capital herself. After carefully analyzing the firms financial statements and talking to the underwriters, Julie estimated that the firms weighted average cost of capital was around 14%. When she consulted with her boss, Pete Rogers, she was pleased to learn that the firm had been using 14% recently as the hurdle rate for all project evaluations. What troubled her was the fact that, like her previous employer, these folks too were not using differential hurdle rates for the three different divisions. Here we go again, thought Julie. I should have asked about this at the interview. Oh well! I guess its too late now. Ive got to do what Ive got to do!
Built-Rite Products Inc., based in Raleigh, North Carolina, employed 5,200 people at its various corporate and manufacturing facilities. Its three divisions were organized on the basis of the type of products manufactured and the clientele served. The defense division accounted for around 55% of the sales volume, while the other two divisions split the balance. The company manufactured and supplied high-quality storage units made from aluminum, plastic, and wood. During the past few years the defense division had done extremely well and was bringing in the majority of the firms profits. However, as is typical of most defense contractors, there had been significant volatility in its sales and earnings figures over the past eight years. The consumer products and industrial supply divisions had been far less volatile, but their profit margins had been lower. Overall, though, the firm was fairly well diversified, and its beta had been estimated at 1.1.
Julie decided that she had better figure out a more logical method of adjusting the divisional hurdle rates, because she strongly believed that failure to do so would result in the firm making unwise capital budgeting decisions. Given her training and philosophy, there was no way she was going to allow projects to be evaluated without due consideration being given to their respective volatilities. We are not all alike, she said to her boss, Pete, and we should not pretend to be. Dont you agree? To her good luck, Pete agreed. So Julie went to work.
The first thing she did was refer back to her notes from graduate school (they do come in handy sometimes, you know) and remembered that there were two ways she could go about doing the adjustment for differences in risk across corporate divisions. One way was to measure or collect the equity betas of comparable homogeneous companies and substitute those in place of the firms overall beta when calculating the weighted average cost of capital. The other way was to simply adjust the firms weighted average cost of capital up or down based on the relative variability of each divisions sales and/or earnings. After doing some research on the Internet, Julie decided against the first option because most of the firms competitors were involved in multiple industry sectors. Accordingly, she
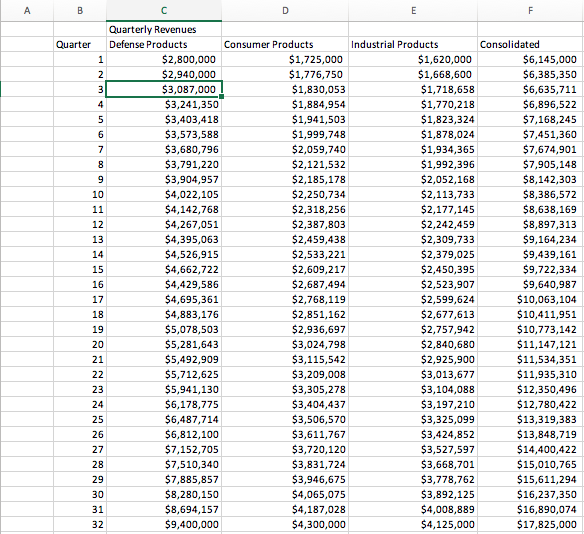
decided to go ahead with the second alternative and requested the accounting department to provide her with quarterly sales data for the prior eight years broken down by divisions (Table 2). She calculated the relative variability of each divisions revenues with respect to that of the overall firm and accordingly adjusted the firms hurdle rate when evaluating proposals submitted by each department.
After doing some quick calculations, Julie sent emails to the vice presidents of the three divisions setting up a time for a meeting. Somehow, Julie knew that it was not going to be a pleasant meeting.
Questions:
-
Using the data given in Table 2, determine the relative variability of each divisions sales as compared to that of the consolidated firm. Which one is the riskiest, and why?
-
Explain the process by which Julie must have determined the hurdle rate for the entire company. The corporate tax rate was 40%, the yield on outstanding bonds was 11%, treasury bills were yielding 4%, and the market risk premium was estimated at 10%. The company currently had 30% of its capital in the form of debt and the remaining in the form of common stock.
-
What is meant by the pure play approach to estimating the required return on an investment?
-
Using Julies methodology of adjusting the firms hurdle rate based on the relative variability of
each divisions sales in relation to that of the consolidated firm, calculate the divisional hurdle
rates.
-
Comment on this methodology of estimating the divisional hurdle rates. Do you agree with it or
not? Explain your answer.
-
Using the firms overall weighted average cost of capital, evaluate the three divisions project
proposals. What are your findings?
-
How are the decisions affected when the divisional hurdle rates are used instead?
Table 1:
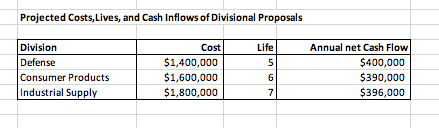
Table 2:
Projected Costs,Lives, and Cash Inflows of Divisional Proposals Annual net Cash Flow Division Defense Consumer Products Industrial Supply Cost Life $1,400,000 $400,000 5 $1,600,000 $390,000 6 $1,800,000 $396,000 7 A E F Quarterly Revenues Industrial Products Defense Products Consumer Products Quarter Consolidated $2,800,000 $1,725,000 $1,620,000 $6,145,000 1 $2,940,000 $1,776,750 $1,668,600 $6,385,350 2. $3,087,000 $1,830,053 $1,718,658 $6,635,711 3 $3,241,350 $1,884,954 $1,770,218 $6,896,522 4 $3,403,418 $1,941,503 $1,823,324 $7,168,245 5 $3,573,588 $1,999,748 $1,878,024 $7,451,360 6 $3,680,796 $2,059,740 $1,934,365 $7,674,901 $3,791,220 $2,121,532 $1,992,396 $7,905,148 8 $3,904,957 $2,185,178 $2,052,168 $8,142,303 9 $4,022,105 $2,250,734 $2,113,733 $8,386,572 10 $4,142,768 $2,318,256 $2,177,145 $8,638,169 11 $4,267,051 $2,387,803 $2,242,459 $8,897,313 12 $4,395,063 $2,459,438 $2,309,733 $9,164,234 13 $4,526,915 $2,533,221 $2,379,025 $9,439,161 14 $4,662,722 $2,609,217 $2,450,395 $9,722,334 15 $4,429,586 $2,687,494 $2,523,907 $9,640,987 16 $4,695,361 $2,768,119 $2,599,624 $10,063,104 17 $4,883,176 $2,851,162 $2,677,613 $10,411,951 18 $5,078,503 $2,936,697 $2,757,942 $10,773,142 19 $5,281,643 $3,024,798 $2,840,680 $11,147,121 20 $5,492,909 $3,115,542 $2,925,900 $11,534,351 21 $5,712,625 $3,209,008 $3,013,677 $11,935,310 22 $5,941,130 $3,305,278 $3,104,088 $12,350,496 23 $6,178,775 $3,404,437 $3,197,210 $12,780,422 24 $6,487,714 $3,506,570 $3,325,099 $13,319,383 25 $6,812,100 $3,611,767 $3,424,852 $13,848,719 26 $7,152,705 $3,720,120 $3,527,597 $14,400,422 27 $7,510,340 $3,831,724 $3,668,701 $15,010,765 28 $7,885,857 $3,946,675 $3,778,762 $15,611,294 29 $8,280,150 $4,065,075 $3,892,125 $16,237,350 30 $8,694,157 $4,187,028 $4,008,889 $16,890,074 31 $9,400,000 $4,300,000 $4,125,000 $17,825,000 32 Projected Costs,Lives, and Cash Inflows of Divisional Proposals Annual net Cash Flow Division Defense Consumer Products Industrial Supply Cost Life $1,400,000 $400,000 5 $1,600,000 $390,000 6 $1,800,000 $396,000 7 A E F Quarterly Revenues Industrial Products Defense Products Consumer Products Quarter Consolidated $2,800,000 $1,725,000 $1,620,000 $6,145,000 1 $2,940,000 $1,776,750 $1,668,600 $6,385,350 2. $3,087,000 $1,830,053 $1,718,658 $6,635,711 3 $3,241,350 $1,884,954 $1,770,218 $6,896,522 4 $3,403,418 $1,941,503 $1,823,324 $7,168,245 5 $3,573,588 $1,999,748 $1,878,024 $7,451,360 6 $3,680,796 $2,059,740 $1,934,365 $7,674,901 $3,791,220 $2,121,532 $1,992,396 $7,905,148 8 $3,904,957 $2,185,178 $2,052,168 $8,142,303 9 $4,022,105 $2,250,734 $2,113,733 $8,386,572 10 $4,142,768 $2,318,256 $2,177,145 $8,638,169 11 $4,267,051 $2,387,803 $2,242,459 $8,897,313 12 $4,395,063 $2,459,438 $2,309,733 $9,164,234 13 $4,526,915 $2,533,221 $2,379,025 $9,439,161 14 $4,662,722 $2,609,217 $2,450,395 $9,722,334 15 $4,429,586 $2,687,494 $2,523,907 $9,640,987 16 $4,695,361 $2,768,119 $2,599,624 $10,063,104 17 $4,883,176 $2,851,162 $2,677,613 $10,411,951 18 $5,078,503 $2,936,697 $2,757,942 $10,773,142 19 $5,281,643 $3,024,798 $2,840,680 $11,147,121 20 $5,492,909 $3,115,542 $2,925,900 $11,534,351 21 $5,712,625 $3,209,008 $3,013,677 $11,935,310 22 $5,941,130 $3,305,278 $3,104,088 $12,350,496 23 $6,178,775 $3,404,437 $3,197,210 $12,780,422 24 $6,487,714 $3,506,570 $3,325,099 $13,319,383 25 $6,812,100 $3,611,767 $3,424,852 $13,848,719 26 $7,152,705 $3,720,120 $3,527,597 $14,400,422 27 $7,510,340 $3,831,724 $3,668,701 $15,010,765 28 $7,885,857 $3,946,675 $3,778,762 $15,611,294 29 $8,280,150 $4,065,075 $3,892,125 $16,237,350 30 $8,694,157 $4,187,028 $4,008,889 $16,890,074 31 $9,400,000 $4,300,000 $4,125,000 $17,825,000 32
Step by Step Solution
There are 3 Steps involved in it
Step: 1

Get Instant Access to Expert-Tailored Solutions
See step-by-step solutions with expert insights and AI powered tools for academic success
Step: 2

Step: 3
Ace Your Homework with AI
Get the answers you need in no time with our AI-driven, step-by-step assistance
Get Started
AQA AS Accounting Unit 2 Financial And Management Accounting
Authors: Brendan Casey
1st Edition
1500684260?, 978-1500684266