just A & C
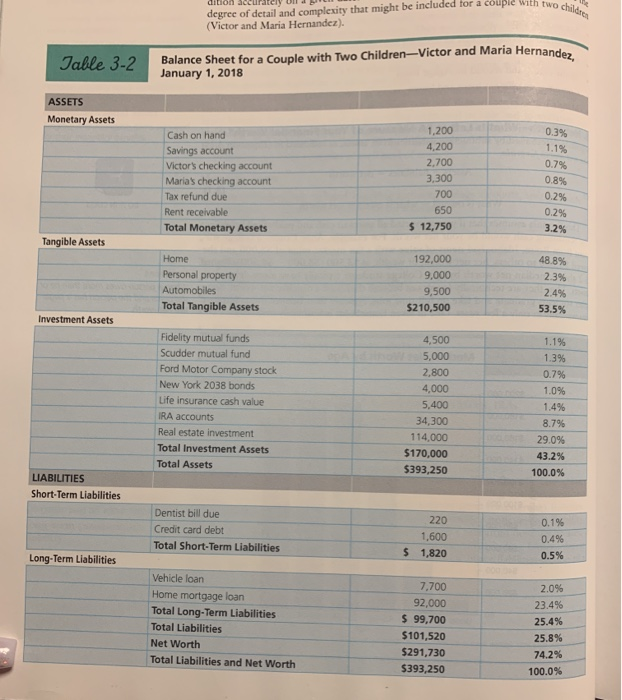
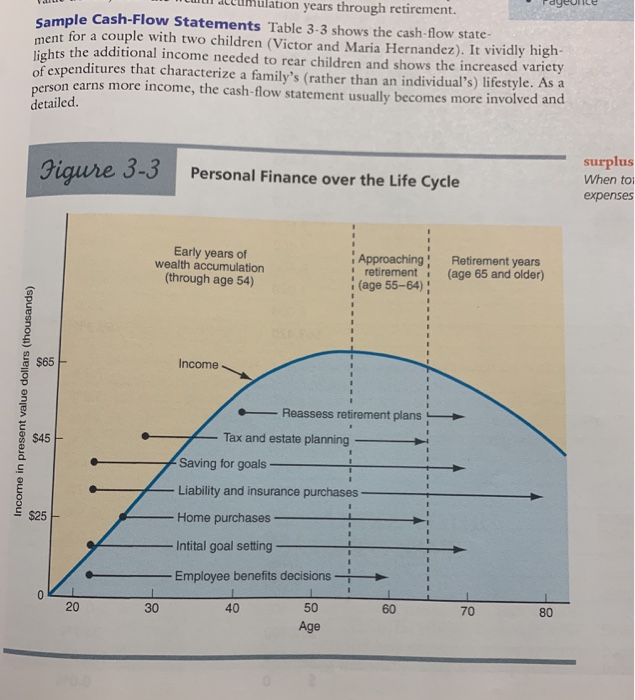
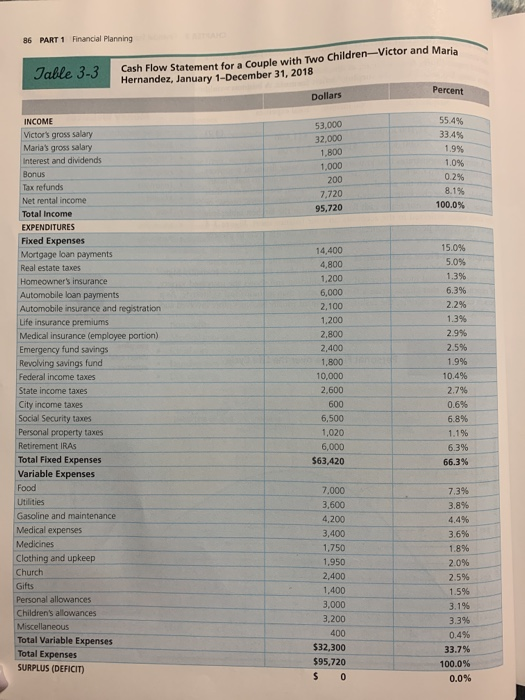
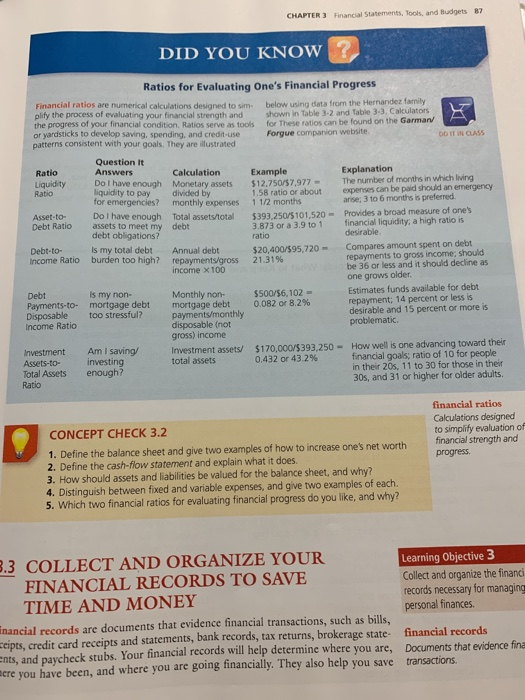
DO THE MATH 1 Ratio Analyses for Victor and Maria. Review the financial statements of Victor and Maria Hernandez (Table 3-2 and Table 3-3) and the financial ratios on page 87 and respond to the following questions: (a) How would you interpret their investment assets to total assets ratio? The Hernandez family appears to have too few monetary assets compared with tangi- ble and investment assets. How would you suggest that they remedy that situation over the next few years? 3 on the Hernandez's liquid- ity ratio? How might they address any issues you (b) What are your thoughts see? (c) Comment on the couple's diversification of their investment assets (d) The Hernandezes seem to receive most of their income from employment rather than investments What actions would you recommend for them to remedy that imbalance over the next few years? (e) The Hernandezes want to take a two-week vacation next summer, and they have only eight months to save the necessary $3,400. What reasonable changes in expenses might they consider to increase net surplus and make the needed $425 per month ($3,400/8) Tennifer Pon- Juc degree of detail and complexity that might be included for a couple With two children dition ac (Victor and Maria Hernandez). Balance Sheet for a Couple with Two Children-Victor and Maria Hernandez January 1, 2018 Table 3-2 ASSETS Monetary Assets 1,200 0.3% Cash on hand 4,200 1.1% Savings account 0.7 % 2,700 Victor's checking account 3,300 0.8% Maria's checking account 700 0.2% Tax refund due Rent receivable 650 0.2% $ 12,750 3.2 % Total Monetary Assets Tangible Assets Home 192,000 48.8% Personal property 9,000 2.3% Automobiles 9,500 2.4 % Total Tangible Assets $210,500 53.5% Investment Assets Fidelity mutual funds 4,500 1.1% Scudder mutual fund 5,000 1.3% Ford Motor Company stock 2,800 0.7 % New York 2038 bonds 4,000 1.0% Life insurance cash value 5,400 1.4% IRA accounts 34,300 8.7 % Real estate investment 114,000 29.0% Total Investment Assets $170,000 43.2% Total Assets $393,250 100.0% LIABILITIES Short-Term Liabilities Dentist bill due 220 0.1% Credit card debt 1,600 0.4 % Total Short-Term Liabilities $ 1,820 0.5% Long-Term Liabilities Vehicle loan 7,700 2.0% Home mortgage loan 92,000 23.4 % Total Long-Term Liabilities $ 99,700 25.4% Total Liabilities $101,520 25.8 % Net Worth $291,730 74.2% Total Liabilities and Net Worth $393,250 100.0% mulation years through retirement. sample Cash-Flow Statements Table 3-3 shows the cash-flow state- ment for a couple with two children (Victor and Maria Hernandez). It vividly high- lights the additional income needed to rear children and shows the increased variety of expenditures that characterize a family's (rather than an individual's) lifestyle. As a person earns more income, the cash-flow statement usually becomes more involved and detailed surplus Figure 3-3 Personal Finance over the Life Cycle When to expenses Early years of wealth accumulation (through age 54) Approaching retirement (age 55-64) Retirement years (age 65 and older) $65 Income Reassess retirement plans Tax and estate planning $45 Saving for goals Liability and insurance purchases Home purchases Intital goal setting Employee benefits decisions 0 40 50 70 Age 80 60 30 20 26 present value dollars (thousands) 86 PART 1 Financial Planning Cash Flow Statement for a Couple with Two Children-Victor and Maria Hernandez, January 1-December 31, 2018 Jable 3-3 Percent Dollars 55.4 % INCOME 53,000 Victor's gross salary 33.4 % 32,000 Maria's gross salary 1.9% 1,800 Interest and dividends 1.0% 1,000 Bonus 0.2% 200 Tax refunds 8.1% 7,720 Net rental income 100.0 % 95,720 Total Income EXPENDITURES Fixed Expenses 15.0 % 14,400 Mortgage loan payments 5.0% 4,800 Real estate taxes 1.3% 1,200 Homeowner's insurance 6.3% 6,000 Automobile loan payments Automobile insurance and registration 2.2% 2,100 1.3% 1,200 Life insurance premiums Medical insurance (employee portion) 2.9% 2,800 2,400 2.5% Emergency fund savings 1,800 1.9% Revolving savings fund 10,000 10.4% Federal income taxes 2,600 2.7% State income taxes 600 0.6 % City income taxes Social Security taxes 6,500 6.8% Personal property taxes 1,020 1.1% Retirement IRAS 6,000 6.3% Total Fixed Expenses $63,420 66.3 % Variable Expenses Food 7,000 7.3% Utilities Gasoline and maintenance 3,600 3.8% 4,200 4.4% Medical expenses 3,400 3.6% Medicines Clothing and upkeep 1,750 1.8% 1,950 2.0% Church 2,400 2.5% Gifts 1,400 1.5% Personal allowances 3,000 3.1% Children's allowances 3,200 3.3% Miscellaneous 400 0.4% Total Variable Expenses Total Expenses SURPLUS (DEFICIT) $32,300 33.7 % $95,720 100.0% S 0 0.0% 87 CHAPTER 3 Financial Statements, Tools, and Budgets DID YOU KNOW Ratios for Evaluating One's Financial Progress Financial ratios are numerical calculations designed to sim- plify the process of evaluating your financial strength and the progress of your financial condition. Ratios serve as tools or yardsticks to develop saving, spending, and credit-use patterns consistent with your goals. They are ilustrated below using data from the Hernandez family shown in Table 3-2 and Table 3-3. Calculators for These ratios can be found on the Garman Forgue companion website DO IT iN CLAS5 Question It Answers Ratio Liquidity Ratio Explanation The number of months in which living expenses can be paid should an emergency arise; 3 to 6 months is preferred. Provides a broad measure of one's financial liquidity, a high ratio is desirable Calculation Example $12,750/57,977 1.58 ratio or about 1 1/2 months Do I have enough liquidity to pay for emergencies? Do I have enough assets to meet my debt obligations? Monetary assets divided by monthly expenses Asset-to- Total assets/total debt $393,250/5101,520- 3.873 or a 3.9 to 1 ratio Debt Ratio Debt-to- Income Ratio Annual debt repayments/gross income x100 Compares amount spent on debt repayments to gross income; should be 36 or less and it should decline as one grows older Is my total debt burden too high? $20,400/$95,720- 21.319% Estimates funds available for debt repayment; 14 percent or less is desirable and 15 percent or more is problematic. Debt Payments-to- Disposable Income Ratio is my non- mortgage debt too stressful? Monthly non- mortgage debt payments/monthly disposable (not gross) income $500/$6,102- 0.082 or 8.2 % $170,000/5393,250-How well is one advancing toward their financial goals; ratio of 10 for people in their 20s, 11 to 30 for those in their 30s, and 31 or higher for older adults. Am I saving/ investing enough? Investment Assets-to- Total Assets Ratio Investment assets/ total assets 0.432 or 43.2% financial ratios Calculations designed to simplify evaluation of financial strength and CONCEPT CHECK 3.2 1. Define the balance sheet and give two examples of how to increase one's net worth 2. Define the cash-flow statement and explain what it does. 3. How should assets and liabilities be valued for the balance sheet, and why? 4. Distinguish between fixed and variable expenses, and give two examples of each. 5. Which two financial ratios for evaluating financial progress do you like, and why? progress 8.3 COLLECT AND ORGANIZE YOUR FINANCIAL RECORDS TO SAVE Learning Objective 3 Collect and organize the financi records necessary for managing personal finances TIME AND MONEY inancial records are documents that evidence financial transactions, such as bills, eipts, credit card receipts and statements, bank records, tax returns, brokerage state- ents, and paycheck stubs. Your financial records will help determine where you are, cre you have been, and where you are going financially. They also help you save financial records Documents that evidence fina transactions