

Question
Just an FYI: I'm using a Mac. There are over 20,000 data cells in this document. I tried to highlight the columns that had blanks
Just an FYI: I'm using a Mac. There are over 20,000 data cells in this document. I tried to highlight the columns that had blanks in them in Excel (there are about 4 columns with different empty cells), and go to the button "Go To Special..," click "Blanks,' then = shift + ^ and fn + Command + enter I get an error message (Circular reference error) and then zero's in all the empty cells. I watched endless tutorials and I'm still getting the same answer, even with a different data set. I still get 0. Now I'm not getting no error message but still 0's.
What am I doing wrong? Please help. I need this answer ASAP.
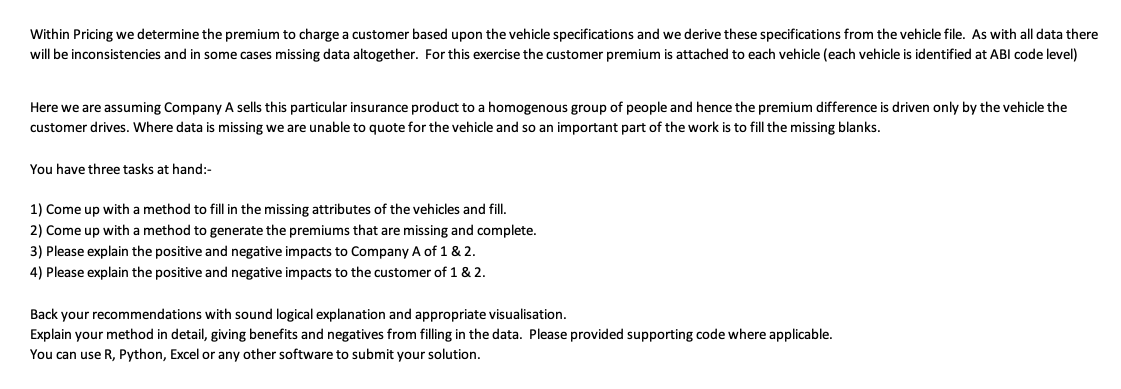
Within Pricing we determine the premium to charge a customer based upon the vehicle specifications and we derive these specifications from the vehicle file. As with all data there will be inconsistencies and in some cases missing data altogether. For this exercise the customer premium is attached to each vehicle (each vehicle is identified at ABI code level) Here we are assuming Company A sells this particular insurance product to a homogenous group of people and hence the premium difference is driven only by the vehicle the customer drives. Where data is missing we are unable to quote for the vehicle and so an important part of the work is to fill the missing blanks. You have three tasks at hand:- 1) Come up with a method to fill in the missing attributes of the vehicles and fill. 2) Come up with a method to generate the premiums that are missing and complete. 3) Please explain the positive and negative impacts to Company A of 1 & 2. 4) Please explain the positive and negative impacts to the customer of 1 & 2. Back your recommendations with sound logical explanation and appropriate visualisation. Explain your method in detail, giving benefits and negatives from filling in the data. Please provided supporting code where applicable. You can use R, Python, Excel or any other software to submit your solution. Within Pricing we determine the premium to charge a customer based upon the vehicle specifications and we derive these specifications from the vehicle file. As with all data there will be inconsistencies and in some cases missing data altogether. For this exercise the customer premium is attached to each vehicle (each vehicle is identified at ABI code level) Here we are assuming Company A sells this particular insurance product to a homogenous group of people and hence the premium difference is driven only by the vehicle the customer drives. Where data is missing we are unable to quote for the vehicle and so an important part of the work is to fill the missing blanks. You have three tasks at hand:- 1) Come up with a method to fill in the missing attributes of the vehicles and fill. 2) Come up with a method to generate the premiums that are missing and complete. 3) Please explain the positive and negative impacts to Company A of 1 & 2. 4) Please explain the positive and negative impacts to the customer of 1 & 2. Back your recommendations with sound logical explanation and appropriate visualisation. Explain your method in detail, giving benefits and negatives from filling in the data. Please provided supporting code where applicable. You can use R, Python, Excel or any other software to submit your solutionStep by Step Solution
There are 3 Steps involved in it
Step: 1

Get Instant Access to Expert-Tailored Solutions
See step-by-step solutions with expert insights and AI powered tools for academic success
Step: 2

Step: 3
Ace Your Homework with AI
Get the answers you need in no time with our AI-driven, step-by-step assistance
Get Started
M: Finance
Authors: Marcia Cornett, Troy Adair, John Nofsinger
5th Edition
1260772357, 9781260772357