Answered step by step
Verified Expert Solution
Link Copied!

Question

1 Approved Answer

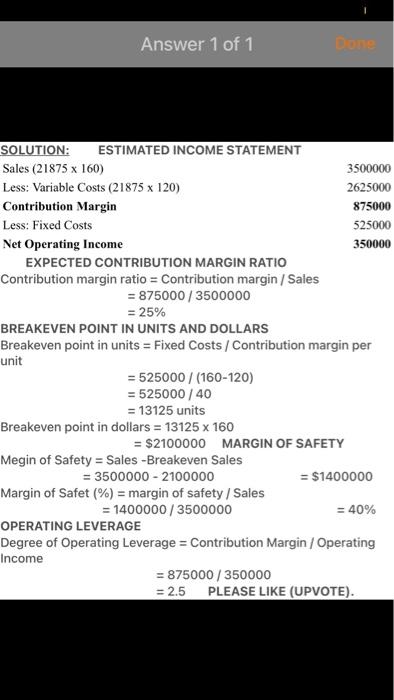
just do number 4 the cost volume profit chart indicating break even sales Chapter 19 Cost-Volume-Profit Analysis PR 19-6A Contribution margin, break-even sales, cost-volume-profit chart.

just do number 4 the cost volume profit chart indicating break even sales image text in transcribed
image text in transcribed
Chapter 19 Cost-Volume-Profit Analysis PR 19-6A Contribution margin, break-even sales, cost-volume-profit chart. Obj. 2.3.4.5 2.2596 Wolsey Industries Inc. expects to maintain the same inventories at the end of 2013 as a margin of safety, and operating leverage beginning of the year. The total of all production costs for the year is therefore assumed to be submit estimates of the costs for their departments during the year. A summary report of these equal to the cost of goods sold. With this in mind, the various department heads were asked to EL TEMPLATE Estimated Variable cost estimates is as follows: Fixed Cost Estimated (per unit sold) $ 46 40 20 8 Production costs: Direct materials. Direct labor $200,000 Factory overhead. Selling expenses 110,000 Sales salaries and commissions. 40,000 Advertising.. 12,000 Travel.. 7,600 Miscellaneous selling expense Administrative expenses: Office and officers'salaries .... 132,000 Supplies........ 10,000 Miscellaneous administrative expense. 13,400 Total......... $525,000 It is expected that 21,875 units will be sold at a price of $160 a unit. Maximum sales within the relevant range are 27,000 units. Instructions 1. Prepare an estimated income statement for 20Y3. 2. What is the expected contribution margin ratio? 3. Determine the break-even sales in units and dollars. 4. Construct a cost-volume-profit chart indicating the break-even sales. 5. What is the expected margin of safety in dollars and as a percentage of sales? 6. Determine the operating leverage. $120 Answer 1 of 1 Done SOLUTION: ESTIMATED INCOME STATEMENT Sales (21875 x 160) 3500000 Less: Variable Costs (21875 x 120) 2625000 Contribution Margin 875000 Less: Fixed Costs 525000 Net Operating Income 350000 EXPECTED CONTRIBUTION MARGIN RATIO Contribution margin ratio = Contribution margin / Sales = 875000/3500000 = 25% BREAKEVEN POINT IN UNITS AND DOLLARS Breakeven point in units = Fixed Costs / Contribution margin per unit = 525000/(160-120) = 525000/40 = 13125 units Breakeven point in dollars = 13125 x 160 = $2100000 MARGIN OF SAFETY Megin of Safety = Sales - Breakeven Sales = 3500000 - 2100000 = $1400000 Margin of Safet (%) = margin of safety / Sales = 1400000/3500000 = 40% OPERATING LEVERAGE Degree of Operating Leverage = Contribution Margin / Operating Income = 875000/350000 = 2.5 PLEASE LIKE (UPVOTE)

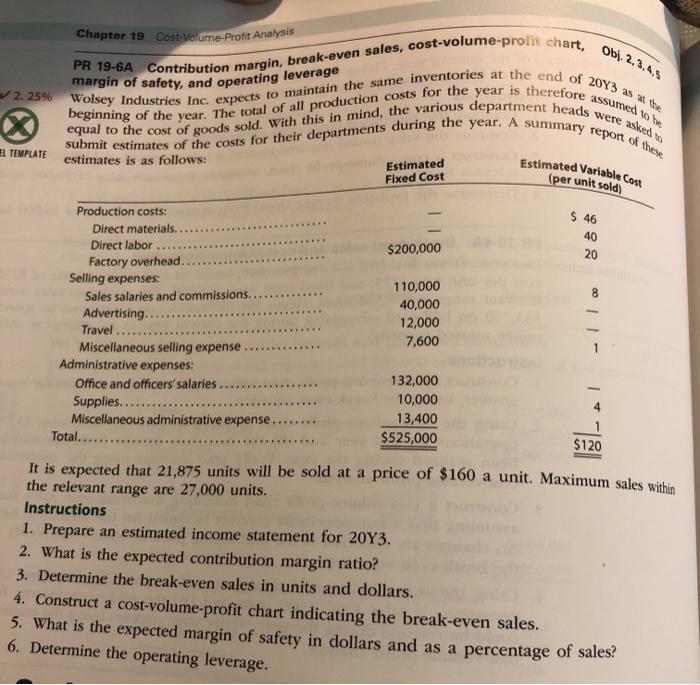
Step by Step Solution

There are 3 Steps involved in it

Step: 1

blur-text-image

Get Instant Access to Expert-Tailored Solutions

See step-by-step solutions with expert insights and AI powered tools for academic success

Step: 2

blur-text-image

Step: 3

blur-text-image

Ace Your Homework with AI

Get the answers you need in no time with our AI-driven, step-by-step assistance

Get Started

Students also viewed these Accounting questions