

Answered step by step
Verified Expert Solution
Question
1 Approved Answer
just give the answer of 5 part 1. Group, where you put all students' name. 2. Data, where you put all daily pricing info and
just give the answer of 5 part
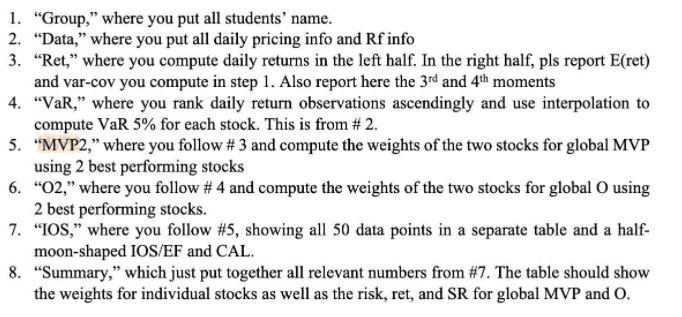
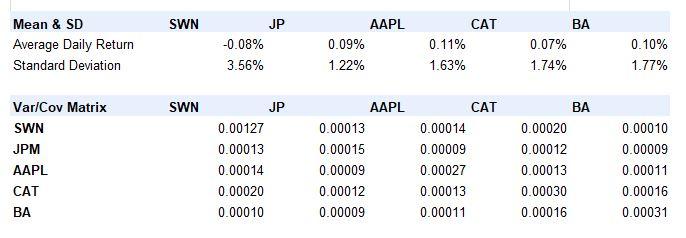
1. "Group," where you put all students' name. 2. "Data," where you put all daily pricing info and Rf info 3. Ret," where you compute daily returns in the left half. In the right half, pls report E(ret) and var-cov you compute in step 1. Also report here the 3rd and 4th moments 4. "VaR," where you rank daily return observations ascendingly and use interpolation to compute VaR 5% for each stock. This is from # 2. 5. "MVP2," where you follow #3 and compute the weights of the two stocks for global MVP using 2 best performing stocks 6. "02," where you follow # 4 and compute the weights of the two stocks for global O using 2 best performing stocks. 7. "IOS," where you follow #5, showing all 50 data points in a separate table and a half- moon-shaped IOS/EF and CAL. 8. "Summary," which just put together all relevant numbers from #7. The table should show the weights for individual stocks as well as the risk, ret, and SR for global MVP and O. SWN Mean & SD Average Daily Return Standard Deviation JP -0.08% 3.56% AAPL 0.09% 1.22% CAT 0.11% 1.63% BA 0.07% 1.74% 0.10% 1.77% SWN Var/Cov Matrix SWN JPM JP 0.00127 0.00013 0.00014 0.00020 0.00010 AAPL 0.00013 0.00015 0.00009 0.00012 0.00009 CAT 0.00014 0.00009 0.00027 0.00013 0.00011 BA 0.00020 0.00012 0.00013 0.00030 0.00016 AAPL CAT BA 0.00010 0.00009 0.00011 0.00016 0.00031 1. "Group," where you put all students' name. 2. "Data," where you put all daily pricing info and Rf info 3. Ret," where you compute daily returns in the left half. In the right half, pls report E(ret) and var-cov you compute in step 1. Also report here the 3rd and 4th moments 4. "VaR," where you rank daily return observations ascendingly and use interpolation to compute VaR 5% for each stock. This is from # 2. 5. "MVP2," where you follow #3 and compute the weights of the two stocks for global MVP using 2 best performing stocks 6. "02," where you follow # 4 and compute the weights of the two stocks for global O using 2 best performing stocks. 7. "IOS," where you follow #5, showing all 50 data points in a separate table and a half- moon-shaped IOS/EF and CAL. 8. "Summary," which just put together all relevant numbers from #7. The table should show the weights for individual stocks as well as the risk, ret, and SR for global MVP and O. SWN Mean & SD Average Daily Return Standard Deviation JP -0.08% 3.56% AAPL 0.09% 1.22% CAT 0.11% 1.63% BA 0.07% 1.74% 0.10% 1.77% SWN Var/Cov Matrix SWN JPM JP 0.00127 0.00013 0.00014 0.00020 0.00010 AAPL 0.00013 0.00015 0.00009 0.00012 0.00009 CAT 0.00014 0.00009 0.00027 0.00013 0.00011 BA 0.00020 0.00012 0.00013 0.00030 0.00016 AAPL CAT BA 0.00010 0.00009 0.00011 0.00016 0.00031Step by Step Solution
There are 3 Steps involved in it
Step: 1

Get Instant Access to Expert-Tailored Solutions
See step-by-step solutions with expert insights and AI powered tools for academic success
Step: 2

Step: 3
Ace Your Homework with AI
Get the answers you need in no time with our AI-driven, step-by-step assistance
Get Started