Just need A
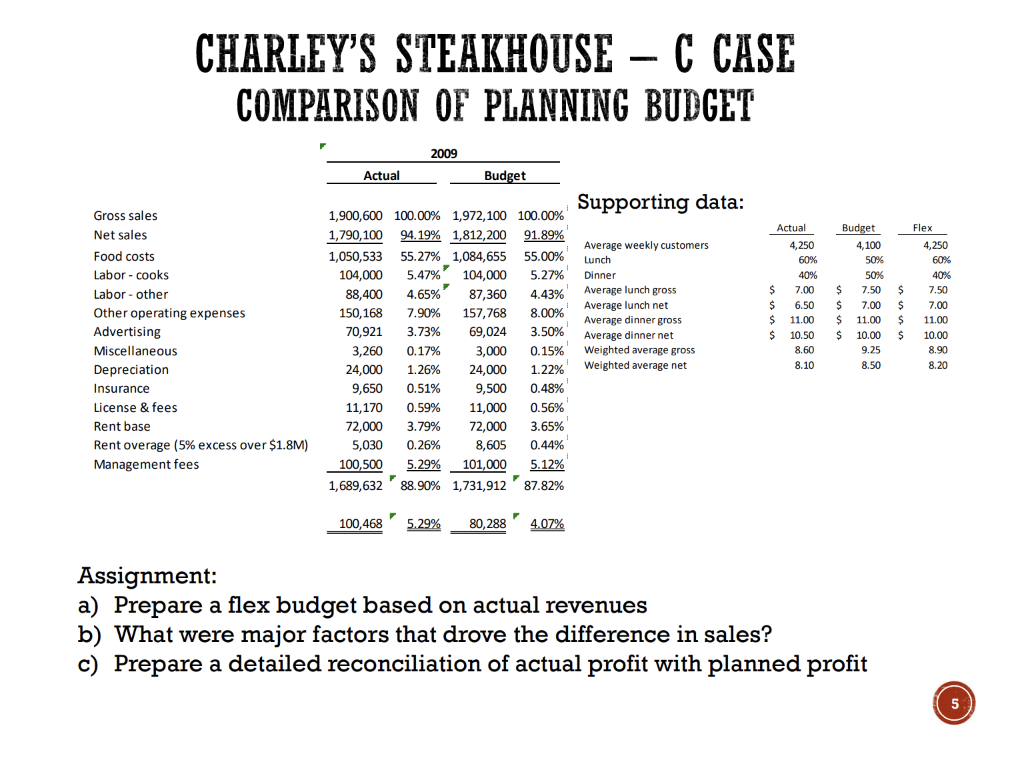
CHARLEY'S STEAKHOUSE - C CASE COMPARISON OF PLANNING BUDGET 2009 Actual Budget Supporting data: 1,900,600 100.00% 1,972,100 100.00%' 1,790,100 94.19% 1,812,200 91.89% Average weekly customers 1,050,533 55.27% 1,084,655 55.00% Lunch 104,000 5.47% 104,000 5.27% Dinner 88,400 4.65% 87,360 4.43% Average lunch gross Average lunch net 150,168 7.90% 157,768 8.00% Average dinner gross 70,921 3.73% 69,024 3.50% Average dinner net 3,260 0.17% 3,000 0.15% Weighted average gross 24,000 1.26% 24,000 1.22% Weighted average net 9,650 0.51% 9,500 11,170 0.59% 11,000 0.56% 72,000 3.79% 72,000 3.65% 5,030 0.26% 8,605 0.44% 100,500 5.29% 101,000 5.12% 1,689,632 88.90% 1,731,912 87.82% Gross sales Net sales Food costs Labor-cooks Labor - other Other operating expenses Advertising Miscellaneous Depreciation Insurance License & fees Rent base Rent overage (5% excess over $1.8M) Management fees Actual 4,250 60% 40% $ 7.00 $ 6.50 $ 11.00 $ 10.50 8.60 8.10 Budget 4,100 50% 50% $ 7.50 $ 7.00 $ 11.00 $ 10.00 9.25 8.50 $ $ $ $ Flex 4,250 60% 40% 7.50 7.00 11.00 10.00 8.90 8.20 100,468' 5.29% 80,288' 4.07% Assignment: a) Prepare a flex budget based on actual revenues b) What were major factors that drove the difference in sales? c) Prepare a detailed reconciliation of actual profit with planned profit CHARLEY'S STEAKHOUSE - C CASE COMPARISON OF PLANNING BUDGET 2009 Actual Budget Supporting data: 1,900,600 100.00% 1,972,100 100.00%' 1,790,100 94.19% 1,812,200 91.89% Average weekly customers 1,050,533 55.27% 1,084,655 55.00% Lunch 104,000 5.47% 104,000 5.27% Dinner 88,400 4.65% 87,360 4.43% Average lunch gross Average lunch net 150,168 7.90% 157,768 8.00% Average dinner gross 70,921 3.73% 69,024 3.50% Average dinner net 3,260 0.17% 3,000 0.15% Weighted average gross 24,000 1.26% 24,000 1.22% Weighted average net 9,650 0.51% 9,500 11,170 0.59% 11,000 0.56% 72,000 3.79% 72,000 3.65% 5,030 0.26% 8,605 0.44% 100,500 5.29% 101,000 5.12% 1,689,632 88.90% 1,731,912 87.82% Gross sales Net sales Food costs Labor-cooks Labor - other Other operating expenses Advertising Miscellaneous Depreciation Insurance License & fees Rent base Rent overage (5% excess over $1.8M) Management fees Actual 4,250 60% 40% $ 7.00 $ 6.50 $ 11.00 $ 10.50 8.60 8.10 Budget 4,100 50% 50% $ 7.50 $ 7.00 $ 11.00 $ 10.00 9.25 8.50 $ $ $ $ Flex 4,250 60% 40% 7.50 7.00 11.00 10.00 8.90 8.20 100,468' 5.29% 80,288' 4.07% Assignment: a) Prepare a flex budget based on actual revenues b) What were major factors that drove the difference in sales? c) Prepare a detailed reconciliation of actual profit with planned profit