

Answered step by step
Verified Expert Solution
Question
1 Approved Answer
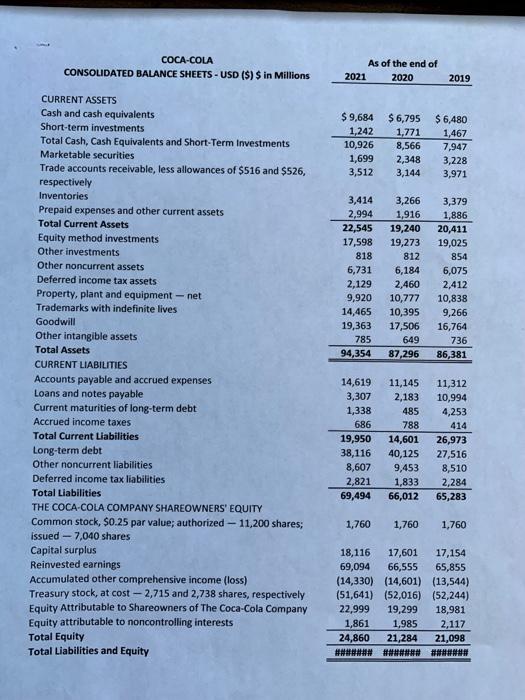
just need help with 4,5&6 Requirements: Use the provided Financial Data (Excel file) for Coke and Pepsi to complete the following analysis: 1. Calculate the
just need help with 4,5&6
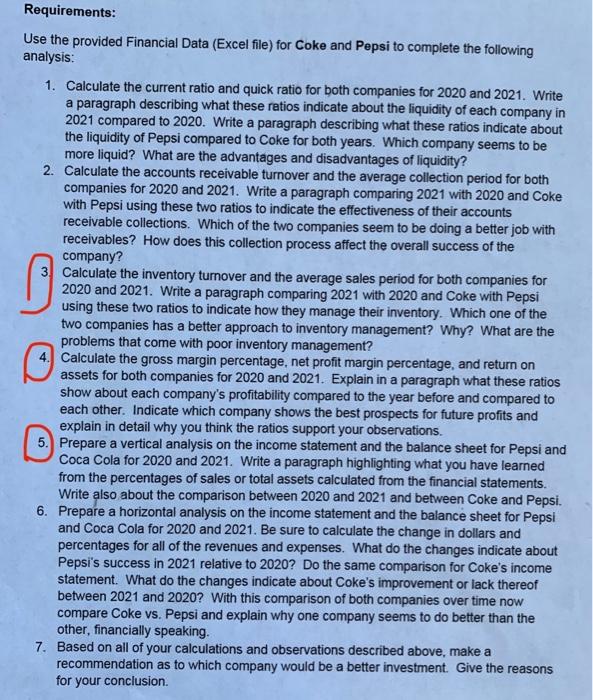
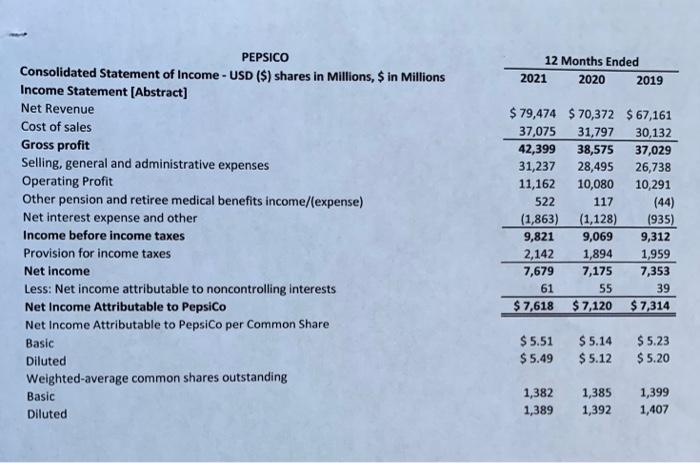
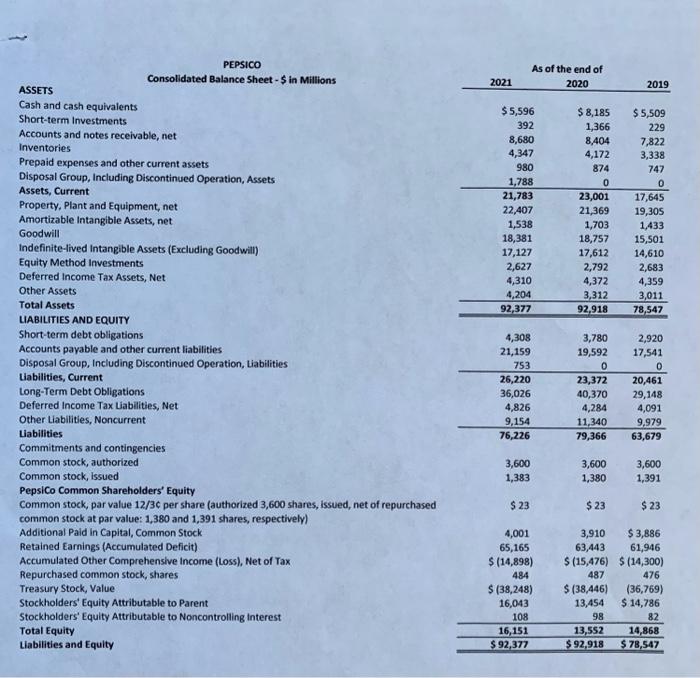
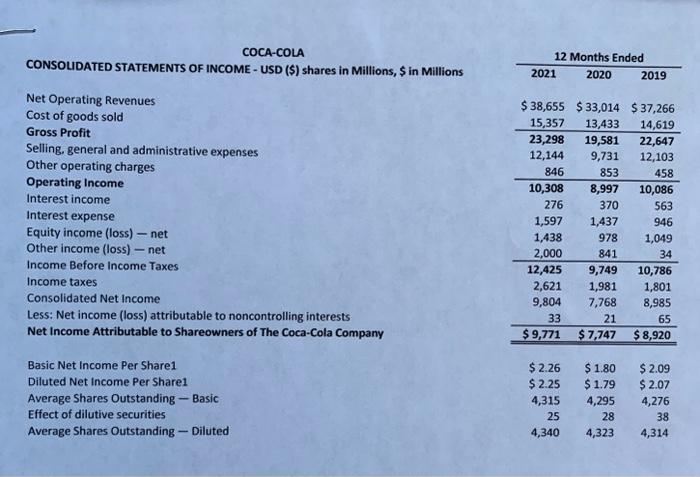
Requirements: Use the provided Financial Data (Excel file) for Coke and Pepsi to complete the following analysis: 1. Calculate the current ratio and quick ratio for both companies for 2020 and 2021 . Write a paragraph describing what these ratios indicate about the liquidity of each company in 2021 compared to 2020 . Write a paragraph describing what these ratios indicate about the liquidity of Pepsi compared to Coke for both years. Which company seems to be more liquid? What are the advantages and disadvantages of liquidity? 2. Calculate the accounts receivable turnover and the average collection period for both companies for 2020 and 2021 . Write a paragraph comparing 2021 with 2020 and Coke with Pepsi using these two ratios to indicate the effectiveness of their accounts receivable collections. Which of the two companies seem to be doing a better job with receivables? How does this collection process affect the overall success of the company? 3. Calculate the inventory turnover and the average sales period for both companies for 2020 and 2021 . Write a paragraph comparing 2021 with 2020 and Coke with Pepsi using these two ratios to indicate how they manage their inventory. Which one of the two companies has a better approach to inventory management? Why? What are the problems that come with poor inventory management? 4. Calculate the gross margin percentage, net profit margin percentage, and return on assets for both companies for 2020 and 2021. Explain in a paragraph what these ratios show about each company's profitability compared to the year before and compared to each other. Indicate which company shows the best prospects for future profits and explain in detail why you think the ratios support your observations. 5. Prepare a vertical analysis on the income statement and the balance sheet for Pepsi and Coca Cola for 2020 and 2021. Write a paragraph highlighting what you have learned from the percentages of sales or total assets calculated from the financial statements. Write also about the comparison between 2020 and 2021 and between Coke and Pepsi. 6. Prepare a horizontal analysis on the income statement and the balance sheet for Pepsi and Coca Cola for 2020 and 2021 . Be sure to calculate the change in dollars and percentages for all of the revenues and expenses. What do the changes indicate about Pepsi's success in 2021 relative to 2020? Do the same comparison for Coke's income statement. What do the changes indicate about Coke's improvement or lack thereof between 2021 and 2020 ? With this comparison of both companies over time now compare Coke vs. Pepsi and explain why one company seems to do better than the other, financially speaking. 7. Based on all of your calculations and observations described above, make a recommendation as to which company would be a better investment. Give the reasons for your conclusion. PEPSICO Consolidated Statement of Income - USD (\$) shares in Millions, $ in Millions Income Statement [Abstract] Net Revenue Cost of sales Gross profit Selling, general and administrative expenses Operating Profit Other pension and retiree medical benefits income/(expense) Net interest expense and other Income before income taxes Provision for income taxes Net income Less: Net income attributable to noncontrolling interests Net Income Attributable to Pepsico Net Income Attributable to PepsiCo per Common Share Basic Diluted Weighted-average common shares outstanding Basic Diluted \begin{tabular}{rrr} $79,474 & $70,372 & $67,161 \\ 37,075 & 31,797 & 30,132 \\ \hline 42,399 & 38,575 & 37,029 \\ 31,237 & 28,495 & 26,738 \\ 11,162 & 10,080 & 10,291 \\ 522 & 117 & (44) \\ (1,863) & (1,128) & (935) \\ \hline 9,821 & 9,069 & 9,312 \\ 2,142 & 1,894 & 1,959 \\ \hline 7,679 & 7,175 & 7,353 \\ 61 & 55 & 39 \\ \hline$7,618 & $7,120 & $7,314 \\ \hline & & \\ $5.51 & $5.14 & $5.23 \\ $5.49 & $5.12 & $5.20 \\ & & \\ \hline 1,382 & 1,385 & 1,399 \\ 1,389 & 1,392 & 1,407 \end{tabular} PEPSICO Consolidated Balance Sheet - $ in Millions ASSETS Cash and cash equivalents Short-term Investments Accounts and notes receivable, net Inventories Prepaid expenses and other current assets Disposal Group, Including Discontinued Operation, Assets Assets, Current Property, Plant and Equipment, net Amortizable Intangible Assets, net Goodwill Indefinite-lived Intangible Assets (Excluding Goodwill) Equity Method Investments Deferred Income Tax Assets, Net Other Assets Total Assets UABILITIES AND EQUITY Short-term debt obligations Accounts payable and other current liabilities Disposal Group, Including Discontinued Operation, Liabilities tiabilities, Current Long-Term Debt Obligations Deferred Income Tax Liabilities, Net Other Liabilities, Noncurrent Labilities Commitments and contingencies Common stock, authorized Common stock, issued PepsiCo Common Shareholders' Equity Common stock, par value 12/3c per share (authorized 3,600 shares, issued, net of repurchased common stock at par value: 1,380 and 1,391 shares, respectively) Additional Paid in Capital, Common Stock Retained Eamings (Accumulated Deficit) Accumulated Other Comprehensive income (Loss), Net of Tax Repurchased common stock, shares Treasury Stock, Value Stockholders' Equity Attributable to Parent Stockholders' Equity Attributable to Noncontrolling interest Total Equity Llabilities and Equity CONSOUDATED STATEMENTS OF INCOME - USD (S) CONSOUDATED STATEMENTS OF INCOME - USD (\$) shares in Millions, $ in Millions Net Operating Revenues Cost of goods sold Gross Profit Selling, general and administrative expenses Other operating charges Operating Income Interest income Interest expense Equity income (loss) - net Other income (loss) - net Income Before Income Taxes Income taxes Consolidated Net Income Less: Net income (loss) attributable to noncontrolling interests Net Income Attributable to Shareowners of The Coca-Cola Company \begin{tabular}{rrr} $38,655 & $33,014 & $37,266 \\ 15,357 & 13,433 & 14,619 \\ \hline 23,298 & 19,581 & 22,647 \\ 12,144 & 9,731 & 12,103 \\ 846 & 853 & 458 \\ \hline 10,308 & 8,997 & 10,086 \\ 276 & 370 & 563 \\ 1,597 & 1,437 & 946 \\ 1,438 & 978 & 1,049 \\ 2,000 & 841 & 34 \\ \hline 12,425 & 9,749 & 10,786 \\ 2,621 & 1,981 & 1,801 \\ 9,804 & 7,768 & 8,985 \\ 33 & 21 & 65 \\ \hline$9,771 & $7,747 & $8,920 \\ \hline \hline \end{tabular} Basic Net Income Per Share1 Diluted Net income Per Share1 Average Shares Outstanding - Basic Effect of dilutive securities Average Shares Outstanding - Diluted $2.26$2.254,315254,340$1.80$1.794,295284,323$2.09$2.074,276384,314 CURRENT ASSETS Cash and cash equivalents Short-term investments Total Cash, Cash Equivalents and Short-Term Investments MarketablesecuritiesTradeaccountsreceivable,lessallowancesof$516and$526,1,5993,5122,3483,1443,2283,971 respectively Inventories Prepaid expenses and other current assets Total Current Assets Equity method investments Other investments Other noncurrent assets Deferred income tax assets Property, plant and equipment - net Trademarks with indefinite lives Goodwill Other intangible assets Total Assets CURRENT LIABILITIES \begin{tabular}{rrr} $9,684 & $6,795 & $6,480 \\ 1,242 & 1,771 & 1,467 \\ \hline 10,926 & 8,566 & 7,947 \\ 1,699 & 2,348 & 3,228 \\ 3,512 & 3,144 & 3,971 \\ & & \\ 3,414 & 3,266 & 3,379 \\ 2,994 & 1,916 & 1,886 \\ \hline 22,545 & 19,240 & 20,411 \\ 17,598 & 19,273 & 19,025 \\ 818 & 812 & 854 \\ 6,731 & 6,184 & 6,075 \\ 2,129 & 2,460 & 2,412 \\ 9,920 & 10,777 & 10,838 \\ 14,465 & 10,395 & 9,266 \\ 19,363 & 17,506 & 16,764 \\ 785 & 649 & 736 \\ \hline 94,354 & 87,296 & 86,381 \\ \hline \end{tabular} Accounts payable and accrued expenses Loans and notes payable Current maturities of long-term debt Accrued income taxes Total Current Labilities Long-term debt Other noncurrent liabilities Deferred income tax liabilities Total Liabilities \begin{tabular}{rrr} 14,619 & 11,145 & 11,312 \\ 3,307 & 2,183 & 10,994 \\ 1,338 & 485 & 4,253 \\ 686 & 788 & 414 \\ \hline 19,950 & 14,601 & 26,973 \\ 38,116 & 40,125 & 27,516 \\ 8,607 & 9,453 & 8,510 \\ 2,821 & 1,833 & 2,284 \\ \hline 69,494 & 66,012 & 65,283 \end{tabular} THE COCA-COLA COMPANY SHAREOWNERS' EQUITY Common stock, $0.25 par value; authorized - 11,200 shares; 1,7601,7601,760 issued 7,040 shares Capital surplus Reinvested earnings Accumulated other comprehensive income (loss) (14,330)(14,601)(13,544) Treasury stock, at cost 2,715 and 2,738 shares, respectively (51,641)(52,016)(52,244) Equity Attributable to Shareowners of The Coca-Cola Company Equity attributable to noncontrolling interests Total Equity Total Liabilities and Equity Requirements: Use the provided Financial Data (Excel file) for Coke and Pepsi to complete the following analysis: 1. Calculate the current ratio and quick ratio for both companies for 2020 and 2021 . Write a paragraph describing what these ratios indicate about the liquidity of each company in 2021 compared to 2020 . Write a paragraph describing what these ratios indicate about the liquidity of Pepsi compared to Coke for both years. Which company seems to be more liquid? What are the advantages and disadvantages of liquidity? 2. Calculate the accounts receivable turnover and the average collection period for both companies for 2020 and 2021 . Write a paragraph comparing 2021 with 2020 and Coke with Pepsi using these two ratios to indicate the effectiveness of their accounts receivable collections. Which of the two companies seem to be doing a better job with receivables? How does this collection process affect the overall success of the company? 3. Calculate the inventory turnover and the average sales period for both companies for 2020 and 2021 . Write a paragraph comparing 2021 with 2020 and Coke with Pepsi using these two ratios to indicate how they manage their inventory. Which one of the two companies has a better approach to inventory management? Why? What are the problems that come with poor inventory management? 4. Calculate the gross margin percentage, net profit margin percentage, and return on assets for both companies for 2020 and 2021. Explain in a paragraph what these ratios show about each company's profitability compared to the year before and compared to each other. Indicate which company shows the best prospects for future profits and explain in detail why you think the ratios support your observations. 5. Prepare a vertical analysis on the income statement and the balance sheet for Pepsi and Coca Cola for 2020 and 2021. Write a paragraph highlighting what you have learned from the percentages of sales or total assets calculated from the financial statements. Write also about the comparison between 2020 and 2021 and between Coke and Pepsi. 6. Prepare a horizontal analysis on the income statement and the balance sheet for Pepsi and Coca Cola for 2020 and 2021 . Be sure to calculate the change in dollars and percentages for all of the revenues and expenses. What do the changes indicate about Pepsi's success in 2021 relative to 2020? Do the same comparison for Coke's income statement. What do the changes indicate about Coke's improvement or lack thereof between 2021 and 2020 ? With this comparison of both companies over time now compare Coke vs. Pepsi and explain why one company seems to do better than the other, financially speaking. 7. Based on all of your calculations and observations described above, make a recommendation as to which company would be a better investment. Give the reasons for your conclusion. PEPSICO Consolidated Statement of Income - USD (\$) shares in Millions, $ in Millions Income Statement [Abstract] Net Revenue Cost of sales Gross profit Selling, general and administrative expenses Operating Profit Other pension and retiree medical benefits income/(expense) Net interest expense and other Income before income taxes Provision for income taxes Net income Less: Net income attributable to noncontrolling interests Net Income Attributable to Pepsico Net Income Attributable to PepsiCo per Common Share Basic Diluted Weighted-average common shares outstanding Basic Diluted \begin{tabular}{rrr} $79,474 & $70,372 & $67,161 \\ 37,075 & 31,797 & 30,132 \\ \hline 42,399 & 38,575 & 37,029 \\ 31,237 & 28,495 & 26,738 \\ 11,162 & 10,080 & 10,291 \\ 522 & 117 & (44) \\ (1,863) & (1,128) & (935) \\ \hline 9,821 & 9,069 & 9,312 \\ 2,142 & 1,894 & 1,959 \\ \hline 7,679 & 7,175 & 7,353 \\ 61 & 55 & 39 \\ \hline$7,618 & $7,120 & $7,314 \\ \hline & & \\ $5.51 & $5.14 & $5.23 \\ $5.49 & $5.12 & $5.20 \\ & & \\ \hline 1,382 & 1,385 & 1,399 \\ 1,389 & 1,392 & 1,407 \end{tabular} PEPSICO Consolidated Balance Sheet - $ in Millions ASSETS Cash and cash equivalents Short-term Investments Accounts and notes receivable, net Inventories Prepaid expenses and other current assets Disposal Group, Including Discontinued Operation, Assets Assets, Current Property, Plant and Equipment, net Amortizable Intangible Assets, net Goodwill Indefinite-lived Intangible Assets (Excluding Goodwill) Equity Method Investments Deferred Income Tax Assets, Net Other Assets Total Assets UABILITIES AND EQUITY Short-term debt obligations Accounts payable and other current liabilities Disposal Group, Including Discontinued Operation, Liabilities tiabilities, Current Long-Term Debt Obligations Deferred Income Tax Liabilities, Net Other Liabilities, Noncurrent Labilities Commitments and contingencies Common stock, authorized Common stock, issued PepsiCo Common Shareholders' Equity Common stock, par value 12/3c per share (authorized 3,600 shares, issued, net of repurchased common stock at par value: 1,380 and 1,391 shares, respectively) Additional Paid in Capital, Common Stock Retained Eamings (Accumulated Deficit) Accumulated Other Comprehensive income (Loss), Net of Tax Repurchased common stock, shares Treasury Stock, Value Stockholders' Equity Attributable to Parent Stockholders' Equity Attributable to Noncontrolling interest Total Equity Llabilities and Equity CONSOUDATED STATEMENTS OF INCOME - USD (S) CONSOUDATED STATEMENTS OF INCOME - USD (\$) shares in Millions, $ in Millions Net Operating Revenues Cost of goods sold Gross Profit Selling, general and administrative expenses Other operating charges Operating Income Interest income Interest expense Equity income (loss) - net Other income (loss) - net Income Before Income Taxes Income taxes Consolidated Net Income Less: Net income (loss) attributable to noncontrolling interests Net Income Attributable to Shareowners of The Coca-Cola Company \begin{tabular}{rrr} $38,655 & $33,014 & $37,266 \\ 15,357 & 13,433 & 14,619 \\ \hline 23,298 & 19,581 & 22,647 \\ 12,144 & 9,731 & 12,103 \\ 846 & 853 & 458 \\ \hline 10,308 & 8,997 & 10,086 \\ 276 & 370 & 563 \\ 1,597 & 1,437 & 946 \\ 1,438 & 978 & 1,049 \\ 2,000 & 841 & 34 \\ \hline 12,425 & 9,749 & 10,786 \\ 2,621 & 1,981 & 1,801 \\ 9,804 & 7,768 & 8,985 \\ 33 & 21 & 65 \\ \hline$9,771 & $7,747 & $8,920 \\ \hline \hline \end{tabular} Basic Net Income Per Share1 Diluted Net income Per Share1 Average Shares Outstanding - Basic Effect of dilutive securities Average Shares Outstanding - Diluted $2.26$2.254,315254,340$1.80$1.794,295284,323$2.09$2.074,276384,314 CURRENT ASSETS Cash and cash equivalents Short-term investments Total Cash, Cash Equivalents and Short-Term Investments MarketablesecuritiesTradeaccountsreceivable,lessallowancesof$516and$526,1,5993,5122,3483,1443,2283,971 respectively Inventories Prepaid expenses and other current assets Total Current Assets Equity method investments Other investments Other noncurrent assets Deferred income tax assets Property, plant and equipment - net Trademarks with indefinite lives Goodwill Other intangible assets Total Assets CURRENT LIABILITIES \begin{tabular}{rrr} $9,684 & $6,795 & $6,480 \\ 1,242 & 1,771 & 1,467 \\ \hline 10,926 & 8,566 & 7,947 \\ 1,699 & 2,348 & 3,228 \\ 3,512 & 3,144 & 3,971 \\ & & \\ 3,414 & 3,266 & 3,379 \\ 2,994 & 1,916 & 1,886 \\ \hline 22,545 & 19,240 & 20,411 \\ 17,598 & 19,273 & 19,025 \\ 818 & 812 & 854 \\ 6,731 & 6,184 & 6,075 \\ 2,129 & 2,460 & 2,412 \\ 9,920 & 10,777 & 10,838 \\ 14,465 & 10,395 & 9,266 \\ 19,363 & 17,506 & 16,764 \\ 785 & 649 & 736 \\ \hline 94,354 & 87,296 & 86,381 \\ \hline \end{tabular} Accounts payable and accrued expenses Loans and notes payable Current maturities of long-term debt Accrued income taxes Total Current Labilities Long-term debt Other noncurrent liabilities Deferred income tax liabilities Total Liabilities \begin{tabular}{rrr} 14,619 & 11,145 & 11,312 \\ 3,307 & 2,183 & 10,994 \\ 1,338 & 485 & 4,253 \\ 686 & 788 & 414 \\ \hline 19,950 & 14,601 & 26,973 \\ 38,116 & 40,125 & 27,516 \\ 8,607 & 9,453 & 8,510 \\ 2,821 & 1,833 & 2,284 \\ \hline 69,494 & 66,012 & 65,283 \end{tabular} THE COCA-COLA COMPANY SHAREOWNERS' EQUITY Common stock, $0.25 par value; authorized - 11,200 shares; 1,7601,7601,760 issued 7,040 shares Capital surplus Reinvested earnings Accumulated other comprehensive income (loss) (14,330)(14,601)(13,544) Treasury stock, at cost 2,715 and 2,738 shares, respectively (51,641)(52,016)(52,244) Equity Attributable to Shareowners of The Coca-Cola Company Equity attributable to noncontrolling interests Total Equity Total Liabilities and Equity Step by Step Solution
There are 3 Steps involved in it
Step: 1

Get Instant Access to Expert-Tailored Solutions
See step-by-step solutions with expert insights and AI powered tools for academic success
Step: 2

Step: 3
Ace Your Homework with AI
Get the answers you need in no time with our AI-driven, step-by-step assistance
Get Started
AS9101D Auditing For Process Performance Combining Conformance And Effectiveness To Meet Customer Satisfaction
Authors: Chad Kymal
1st Edition
0873898079, 978-0873898072