Just need help with number 3 and the adjustments stated above
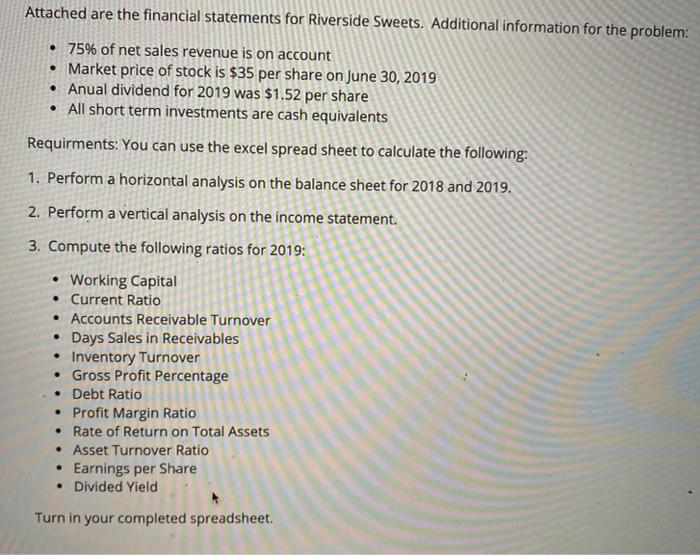
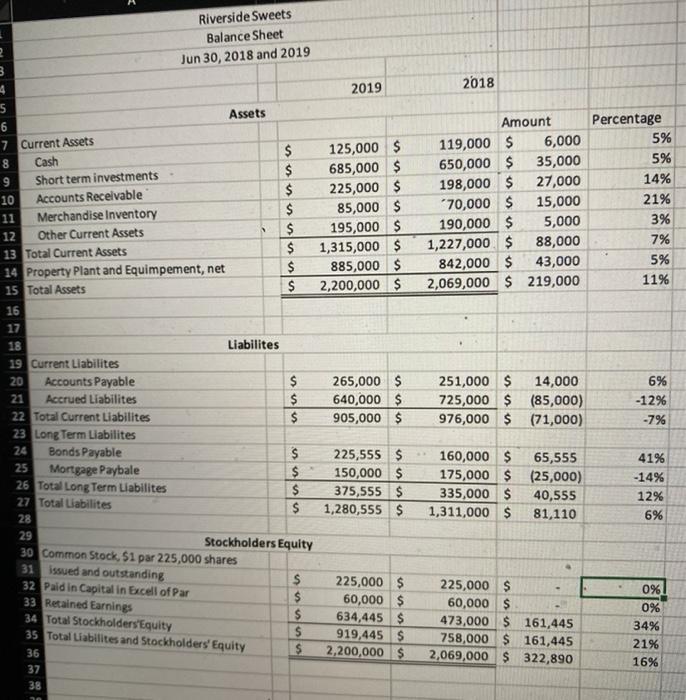
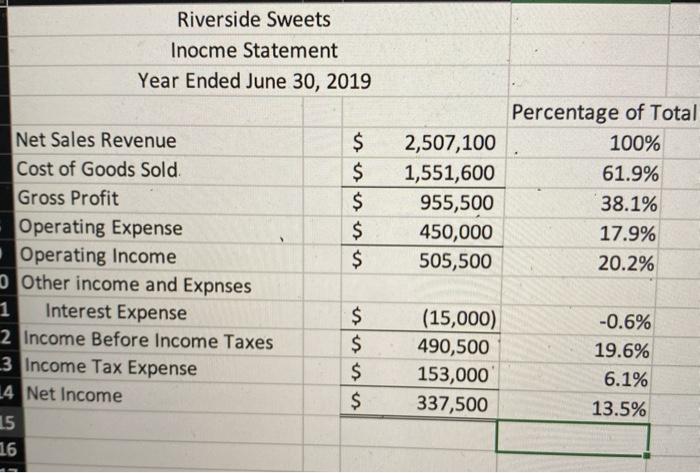
Attached are the financial statements for Riverside Sweets. Additional information for the problem: 75% of net sales revenue is on account Market price of stock is $35 per share on June 30, 2019 Anual dividend for 2019 was $1.52 per share All short term investments are cash equivalents Requirments: You can use the excel spread sheet to calculate the following: 1. Perform a horizontal analysis on the balance sheet for 2018 and 2019. 2. Perform a vertical analysis on the income statement. 3. Compute the following ratios for 2019: Working Capital Current Ratio Accounts Receivable Turnover Days Sales in Receivables Inventory Turnover Gross Profit Percentage Debt Ratio Profit Margin Ratio Rate of Return on Total Assets Asset Turnover Ratio Earnings per Share Divided Yield . Turn in your completed spreadsheet. Riverside Sweets Balance Sheet Jun 30, 2018 and 2019 3 4 2019 2018 Assets S 6 7 Current Assets 8 Cash 9 Short term investments 10 Accounts Receivable 11 Merchandise Inventory 12 Other Current Assets 13 Total Current Assets 14 Property Plant and Equimpement, net 15 Total Assets 16 17 $ $ $ $ $ $ $ $ 125,000 $ 685,000 $ 225,000 $ 85,000 $ 195,000 $ 1,315,000 $ 885,000 $ 2,200,000 $ Amount 119,000 $ 6,000 650,000 $ 35,000 198,000 $ 27,000 70,000 $ 15,000 190,000 $ 5,000 1,227,000 $ 88,000 842,000 $ 43,000 2,069,000 $ 219,000 Percentage 5% 5% 14% 21% 3% 7% 5% 11% 265,000 $ 640,000 $ 905,000 $ 251,000 $ 14,000 725,000 $ (85,000) 976,000 $ (71,000) 6% -12% -7% 25 18 Liabilites 19 Current Liabilites 20 Accounts Payable $ Accrued Liabilites $ 22 Total Current Liabilites $ 23 Long Term Liabilites 24 Bonds Payable $ Mortgage Paybale $ 26 Total Long Term Liabilites $ 27 Total Liabilites $ 28 29 Stockholders Equity 30 Common Stock, 51 par 225,000 shares 31 issued and outstanding $ 32 Paid in Capital in Excell of Par $ 33 Retained Earnings $ 34 Total Stockholders'Equity $ 35 Total Liabilites and Stockholders' Equity $ 36 37 38 225,555 $ 150,000 $ 375,555 $ 1,280,555 $ 160,000 $ 65,555 175,000 $ (25,000) 335,000 $ 40,555 1,311,000 $ 81,110 41% -14% 12% 6% 225,000 $ 60,000 $ 634,445 $ 919,445 $ 2,200,000 $ 225,000 $ 60,000 $ 473,000 $ 161,445 758,000 $ 161,445 2,069,000 $ 322,890 0% 0% 34% 21% 16% Riverside Sweets Inocme Statement Year Ended June 30, 2019 $ $ $ $ $ 2,507,100 1,551,600 955,500 450,000 505,500 Percentage of Total 100% 61.9% 38.1% 17.9% 20.2% Net Sales Revenue Cost of Goods Sold Gross Profit Operating Expense Operating Income Other income and Expnses 1 Interest Expense 2 Income Before Income Taxes 3 Income Tax Expense 14 Net Income 15 16 $ $ $ $ (15,000) 490,500 153,000 337,500 -0.6% 19.6% 6.1% 13.5%


