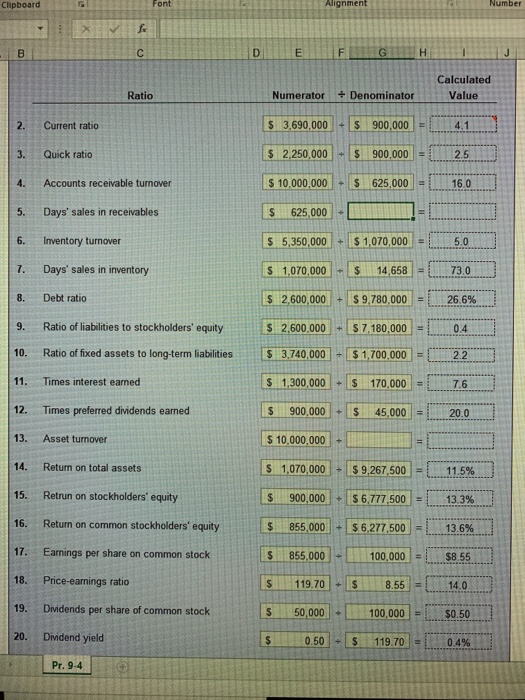
Just need help with the two blanks on numbers 5 and 13...I can't figure out what I'm doing wrong.
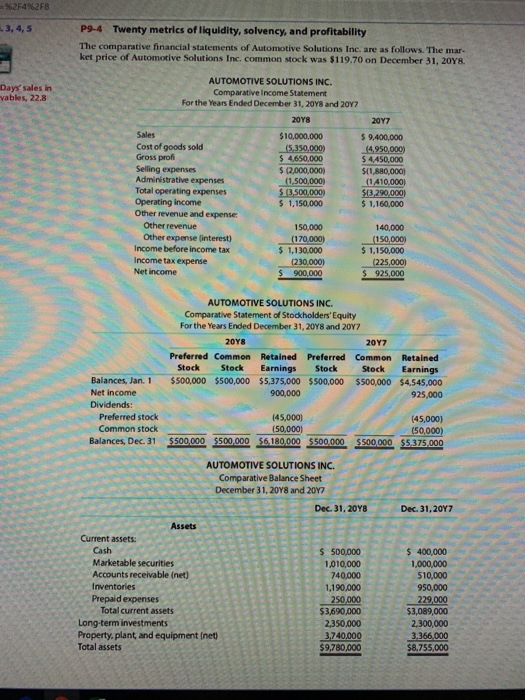
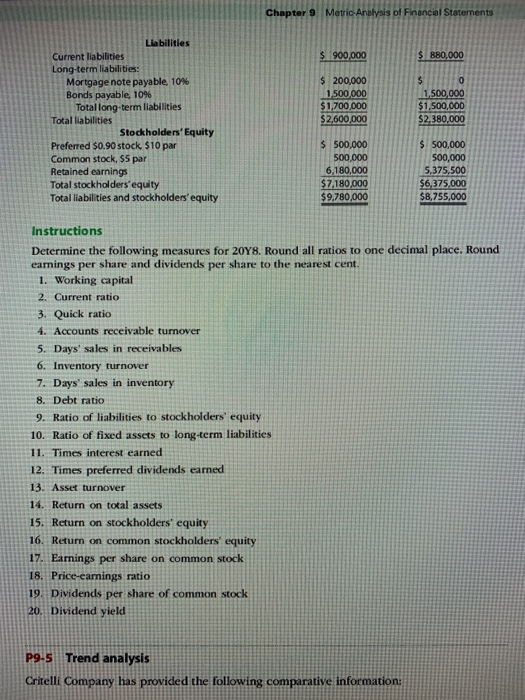
=%2F4%2F8 63,4,5 P9-4 Twenty metrics of liquidity, solvency, and profitability The comparative financial statements of Automotive Solutions Inc. are as follows. The mar- ket price of Automotive Solutions Inc, common stock was $119.70 on December 31, 20Y8. Days' sales in vables, 22,8 2017 54,650.000 AUTOMOTIVE SOLUTIONS INC. Comparative Income Statement For the Year Ended December 31, 2018 and 2017 20Y8 Sales $10,000,000 $9,400,000 Cost of goods sold (5,350,000) (4,950,000) Gross profi $ 4,450,000 Selling expenses $ 12,000,000) $(1,880,000) Administrative expenses (1,500,000) (1410,000) Total operating expenses $13.500.000) $13,290,000) Operating income $ 1,150,000 Other revenue and expense: Other revenue 150,000 Other expense interest) (170.000) (150,000) Income before income tax $ 1.130,000 $ 1.150.000 Income tax expense (230.000) (225,000) Net income $ 925,000 $ 1.160,000 140,000 $ 900.000 AUTOMOTIVE SOLUTIONS INC. Comparative Statement of Stockholders'Equity For the Years Ended December 31, 2018 and 2017 20Y8 2017 Preferred Common Retained Preferred Common Stock Stock Earnings Stock Stock $500,000 $500,000 $5,375,000 $500,000 $500,000 900,000 Balances, Jan. 1 Retained Earnings $4,545,000 925,000 Net Income Dividends: Preferred stock Common stock Balances, Dec.31 (45,000) (45,000) (50.000) (50,000) $500,000 $500,000 $6.180,000 $500,000 $500,000 $5.375,000 UTAMA AUTOMOTIVE SOLUTIONS INC Comparative Balance Sheet December 31, 2048 and 2017 Dec. 31, 20Y8 Dec 31, 2017 Assets 13 Current assets: Cash Marketable securities Accounts receivable (net) Inventories Prepaid expenses Total current assets Long-term investments Property, plant and equipment (net) Total assets $ 500,000 1.010,000 740,000 1,190,000 250,000 $3,690,000 2,350,000 3.740.000 $9,780,000 $400,000 1.000.000 510,000 950,000 229,000 $3,089,000 2,300,000 3.366,000 $8.755,000 Chapter 9 Metric Analysis of Financial Statements $ 900,000 $ 880,000 $ 200,000 1.500.000 $1,700,000 $2,600,000 1,500,000 $1,500,000 $2,380,000 Current liabilities Long-term liabilities: Mortgage note payable 10% Bonds payable 10% Total long-term liabilities Total liabilities Stockholders' Equity Preferred $0.90 stock, $10 par Common stock, $5 par Retained earnings Total stockholders'equity Total liabilities and stockholders'equity $ 500,000 500,000 6,180,000 $7,180,000 $9.780,000 500,000 500,000 5,375,500 $6,375,000 $8.755.000 Instructions Determine the following measures for 2018. Round all ratios to one decimal place. Round earnings per share and dividends per share to the nearest cent. 1. Working capital 2. Current ratio 3. Quick ratio 4. Accounts receivable turnover 5. Days' sales in receivables 6. Inventory turnover 7. Days' sales in inventory 8. Debt ratio 9. Ratio of liabilities to stockholders' equity 10. Ratio of fixed assets to long-term liabilities 11. Times interest earned 12. Times preferred dividends earned 13. Asset turnover 14. Return on total assets 15. Return on stockholders' equity 16. Return on common stockholders' equity 17. Earnings per share on common stock 18. Price-earnings ratio 19. Dividends per share of common stock 20. Dividend yield P9-5 Trend analysis Critelli Company has provided the following comparative information: Clipboard Alignment Number Calculated Value Ratio Numerator - Denominator 2. Current ratio S 3.690,000 + $ 900,000 = 4.1 3. Quick ratio $ 2,250,000 + S 900,000 = 4. Accounts receivable turnover $ 10,000,000 - $ 625,000 = 5. Days' sales in receivables S 625,000 6. Inventory turnover S 5,350,000 + $ 1.070,000 = ! 5.0 7. Days' sales in inventory S 1,070,000 - $ 14,658 = 73.0 8. Debt ratio $ 2,600,000 + S 9.780,000 = 1 26.6% 9. Ratio of liabilities to stockholders' equity s 2.600.000 + $ 7,180,000 = 1 $ 3,740,000 - $ 1,700,000 = 10. Ratio of fixed assets to long-term liabilities 11. Times interest earned $ 1,300,000 - $ 170,000 = 12. Times preferred dividends earned S 900,000 + $ 45,000 = 20.0 13. Asset turnover $ 10,000,000+ 14. Return on total assets S 1,070,000 + $ 9.267.500 = 11.5% 15. Retrun on stockholders' equity $ 900,000 + $ 6777.500 = 855,000 + $ 6,277,500 = 1 16. Return on common stockholders' equity $ 17. Earnings per share on common stock S 855,000 + 100,000 = $8.55 18. Price-earnings ratio 119.70 + S 8 .55 = 14.0 19. Dividends per share of common stock $ $ 50,000 + 0.50 - $ 100,000 = 119.70 = $0.50 0.4% 20. Dividend yield Pr. 9-4