

Answered step by step
Verified Expert Solution
Question
1 Approved Answer
Just need parts e and f, please 12. This problem involves writing functions. (a) Write a function, Power(), that prints out the result of raising
Just need parts e and f, please
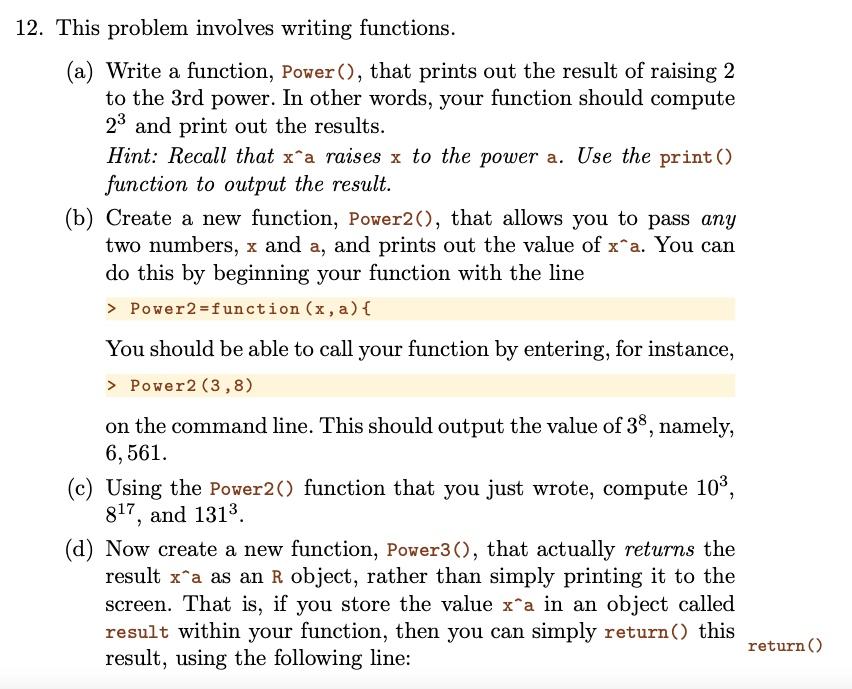
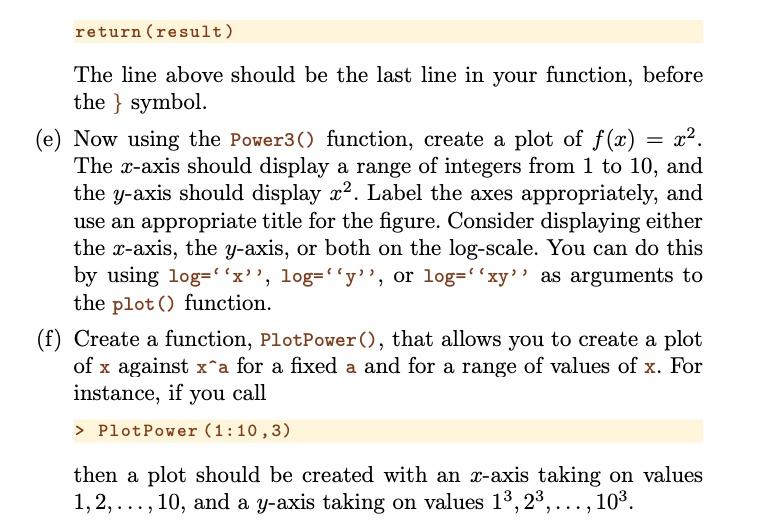
12. This problem involves writing functions. (a) Write a function, Power(), that prints out the result of raising 2 to the 3rd power. In other words, your function should compute 23 and print out the results. Hint: Recall that x'a raises x to the power a. Use the print () function to output the result. (b) Create a new function, Power2(), that allows you to pass any two numbers, x and a, and prints out the value of x^a. You can do this by beginning your function with the line > Power2=function (x, a) { You should be able to call your function by entering, for instance, > Power2 (3,8) on the command line. This should output the value of 38, namely, 6,561. (c) Using the Power2() function that you just wrote, compute 103, 817, and 1313 (d) Now create a new function, Power3(), that actually returns the result xa as an R object, rather than simply printing it to the screen. That is, if you store the value xa in an object called result within your function, then you can simply return() this result, using the following line: return() return (result) The line above should be the last line in your function, before the } symbol. (e) Now using the Power3() function, create a plot of f(x) The x-axis should display a range of integers from 1 to 10, and the y-axis should display x2. Label the axes appropriately, and use an appropriate title for the figure. Consider displaying either the x-axis, the y-axis, or both on the log-scale. You can do this by using log=''x'', log='y', or log=''xy') as arguments to the plot() function. (f) Create a function, PlotPower(), that allows you to create a plot of x against xa for a fixed a and for a range of values of x. For instance, if you call > Plot Power (1:10,3) then a plot should be created with an x-axis taking on values 1,2, ..., 10, and a y-axis taking on values 13, 23, ..., 103. 12. This problem involves writing functions. (a) Write a function, Power(), that prints out the result of raising 2 to the 3rd power. In other words, your function should compute 23 and print out the results. Hint: Recall that x'a raises x to the power a. Use the print () function to output the result. (b) Create a new function, Power2(), that allows you to pass any two numbers, x and a, and prints out the value of x^a. You can do this by beginning your function with the line > Power2=function (x, a) { You should be able to call your function by entering, for instance, > Power2 (3,8) on the command line. This should output the value of 38, namely, 6,561. (c) Using the Power2() function that you just wrote, compute 103, 817, and 1313 (d) Now create a new function, Power3(), that actually returns the result xa as an R object, rather than simply printing it to the screen. That is, if you store the value xa in an object called result within your function, then you can simply return() this result, using the following line: return() return (result) The line above should be the last line in your function, before the } symbol. (e) Now using the Power3() function, create a plot of f(x) The x-axis should display a range of integers from 1 to 10, and the y-axis should display x2. Label the axes appropriately, and use an appropriate title for the figure. Consider displaying either the x-axis, the y-axis, or both on the log-scale. You can do this by using log=''x'', log='y', or log=''xy') as arguments to the plot() function. (f) Create a function, PlotPower(), that allows you to create a plot of x against xa for a fixed a and for a range of values of x. For instance, if you call > Plot Power (1:10,3) then a plot should be created with an x-axis taking on values 1,2, ..., 10, and a y-axis taking on values 13, 23, ..., 103Step by Step Solution
There are 3 Steps involved in it
Step: 1

Get Instant Access to Expert-Tailored Solutions
See step-by-step solutions with expert insights and AI powered tools for academic success
Step: 2

Step: 3
Ace Your Homework with AI
Get the answers you need in no time with our AI-driven, step-by-step assistance
Get Started
Data Management Databases And Organizations
Authors: Richard T. Watson
2nd Edition
0471180742, 978-0471180746