Question
Just need to know the R code to generate this graphic, thanks! Variable | Description ---------|------------ `year` | the year of the birth `month` |

Just need to know the R code to generate this graphic, thanks!
Variable | Description ---------|------------ `year` | the year of the birth `month` | the month of the birth `state` | the state where the birth occurred, including "DC" for Washington D.C. `is_male` | which is `TRUE` if the child is male, `FALSE` otherwise `weight_pounds` | the child's birth weight in pounds `mother_age` | the age of the mother `child_race` | race of the child. `plurality` | the number of children born as a result of the pregnancy, with 1 representing a single birth, 2 representing twins, etc. `region` | the region of the US that the state is part of `state_color` | the political "color" of the state: red, blue, or purple
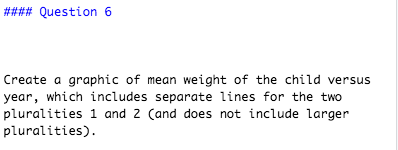
Create a graphic of mean weight of the child versus year, which includes separate lines for the two pluralities 1 and 2 (and does not include larger pluralities)Step by Step Solution
There are 3 Steps involved in it
Step: 1

Get Instant Access to Expert-Tailored Solutions
See step-by-step solutions with expert insights and AI powered tools for academic success
Step: 2

Step: 3

Ace Your Homework with AI
Get the answers you need in no time with our AI-driven, step-by-step assistance
Get Started


