

Answered step by step
Verified Expert Solution
Question
1 Approved Answer
Just really need some help on the part circled in blue! I will rate! Many thanks and God bless!!! Requirements Ref. Formula Analyze the company's
Just really need some help on the part circled in blue!
I will rate!
Many thanks and God bless!!!
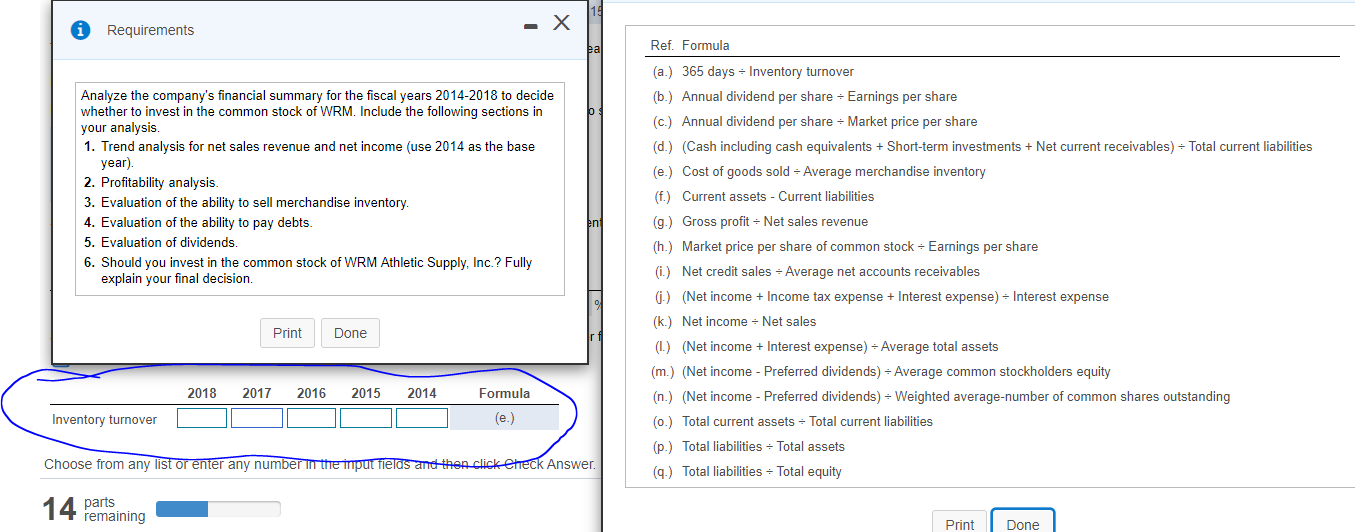
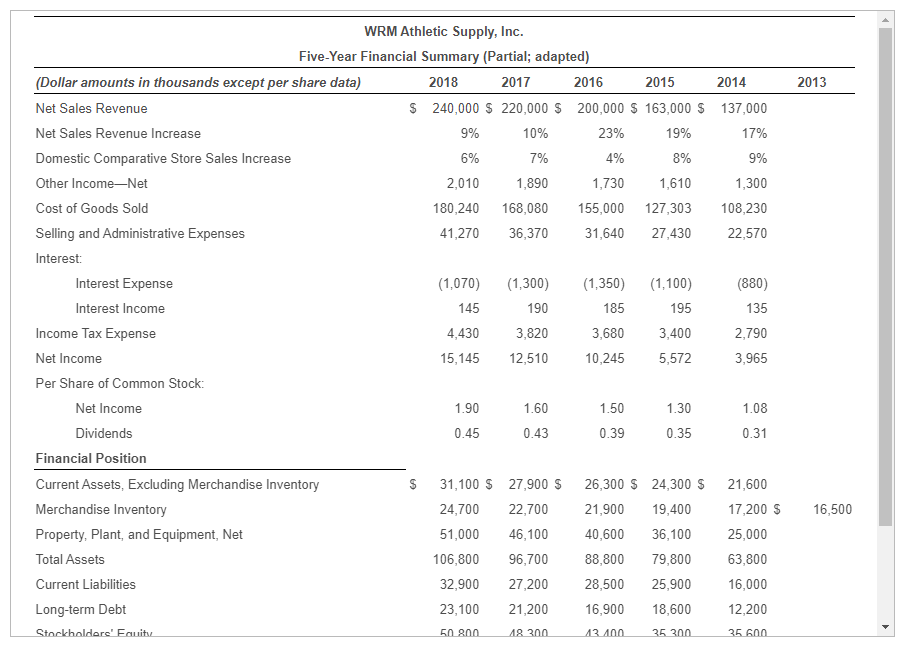
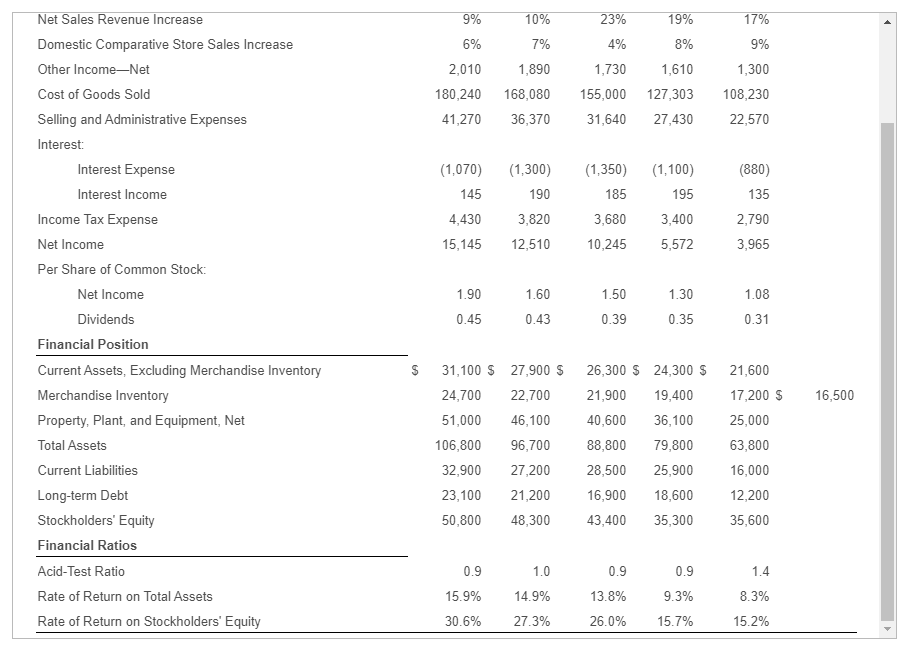
Requirements Ref. Formula Analyze the company's financial summary for the fiscal years 2014-2018 to decide whether to invest in the common stock of WRM. Include the following sections in your analysis. 1. Trend analysis for net sales revenue and net income (use 2014 as the base year). 2. Profitability analysis. 3. Evaluation of the ability to sell merchandise inventory 4. Evaluation of the ability to pay debts 5. Evaluation of dividends. 6. Should you invest in the common stock of WRM Athletic Supply, Inc.? Fully explain your final decision. (a.) 365 days = Inventory turnover (b.) Annual dividend per share = Earnings per share (c.) Annual dividend per share - Market price per share (d.) (Cash including cash equivalents + Short-term investments + Net current receivables) - Total current liabilities (e.) Cost of goods sold - Average merchandise inventory (f.) Current assets - Current liabilities (9.) Gross profit = Net sales revenue (h.) Market price per share of common stock = Earnings per share (i) Net credit sales - Average net accounts receivables C.) (Net income + Income tax expense + Interest expense) - Interest expense (k.) Net income + Net sales (L.) (Net income + Interest expense) = Average total assets (m.) (Net income - Preferred dividends) - Average common stockholders equity (n.) (Net income - Preferred dividends) = Weighted average-number of common shares outstanding (0.) Total current assets - Total current liabilities (p.) Total liabilities - Total assets (9.) Total liabilities - Total equity Print Done 2018 2017 2016 2015 2014 Formula Inventory turnover (e.) Choose from any list or enter any number in the input fields and then click check Answer. 14 parts remaining Print Done 2013 WRM Athletic Supply, Inc. Five-Year Financial Summary (Partial; adapted) (Dollar amounts in thousands except per share data) 2018 2017 2016 2015 2014 Net Sales Revenue $ 240,000 $ 220,000 $ 200,000 $ 163,000 $ 137,000 Net Sales Revenue Increase 9% 10% 23% 19% 17% Domestic Comparative Store Sales Increase 6% 7% 4% 8% 9% Other Income-Net 2,010 1,890 1,730 1,610 1,300 Cost of Goods Sold 180,240 168,080 155,000 127,303 108,230 Selling and Administrative Expenses 41,270 36,370 31,640 27,430 22,570 Interest: Interest Expense (1,070) (1,300) (1,350) (1,100) (880) Interest Income 145 190 185 195 135 Income Tax Expense 4,430 3,820 3,680 3,400 2,790 Net Income 15,145 12,510 10,245 5,572 3,965 Per Share of Common Stock: Net Income 1.90 1.60 1.50 1.30 1.08 Dividends 0.45 0.43 0.39 0.35 0.31 Financial Position Current Assets, Excluding Merchandise Inventory $ 31,100 $ 27,900 $ 26,300 $ 24,300 $ 21,600 Merchandise Inventory 24,700 22,700 19,400 17,200 $ Property, Plant, and Equipment, Net 51,000 46,100 40,600 36,100 25,000 Total Assets 106,800 96,700 88,800 79,800 63,800 Current Liabilities 32,900 27,200 28,500 25,900 16,000 Long-term Debt 23,100 21,200 16,900 18,600 12,200 Stockholders' Equity 50 800 18300 13.400 25 300 35 600 21,900 16,500 9% 10% 23% 19% 17% 6% 7% 4% 8% 1,730 2,010 180,240 41,270 1,890 168,080 36,370 1,610 127,303 9% 1,300 108,230 22,570 155,000 31,640 27,430 (1,070) 145 (1,350) 185 (1,100) 195 (1,300) 190 3,820 12,510 (880) 135 2,790 3,965 3,680 4,430 15,145 3,400 5,572 10,245 1.90 Net Sales Revenue Increase Domestic Comparative Store Sales Increase Other Income,Net Cost of Goods Sold Selling and Administrative Expenses Interest Interest Expense Interest Income Income Tax Expense Net Income Per Share of Common Stock: Net Income Dividends Financial Position Current Assets, Excluding Merchandise Inventory Merchandise Inventory Property, Plant, and Equipment, Net Total Assets Current Liabilities Long-term Debt Stockholders' Equity Financial Ratios Acid-Test Ratio Rate of Return on Total Assets Rate of Return on Stockholders' Equity 1.60 0.43 1.50 0.39 1.30 0.35 1.08 0.31 0.45 $ 16,500 31,100 $ 27,900 $ 26,300 $ 24,300 $ 24,700 22,700 21,900 19,400 51,000 46,100 40,600 36,100 106,800 96,700 88,800 79,800 32,900 27,200 28,500 25,900 23,100 21,200 16,900 18,600 50,800 48,300 43,400 35,300 21,600 17,200 $ 25,000 63,800 16,000 12,200 35,600 0.9 1.0 0.9 0.9 1.4 15.9% 14.9% 13.8% 8.3% 9.3% 15.7% 30.6% 27.3% 26.0% 15.2%Step by Step Solution
There are 3 Steps involved in it
Step: 1

Get Instant Access to Expert-Tailored Solutions
See step-by-step solutions with expert insights and AI powered tools for academic success
Step: 2

Step: 3
Ace Your Homework with AI
Get the answers you need in no time with our AI-driven, step-by-step assistance
Get Started
Managerial Accounting
Authors: Crosson
9th Edition
B00650WABQ