Just some points on the main findings of the paper/ what the results mean!
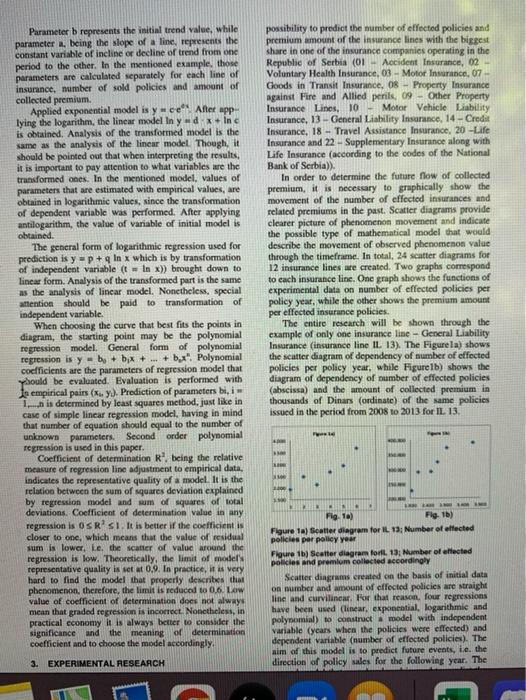
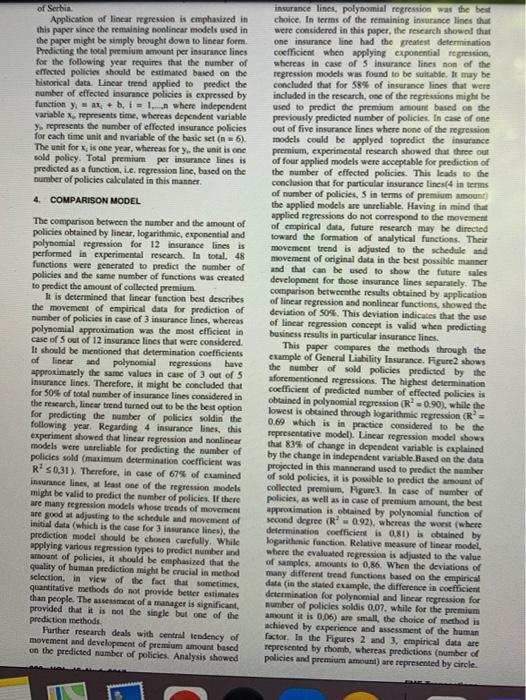
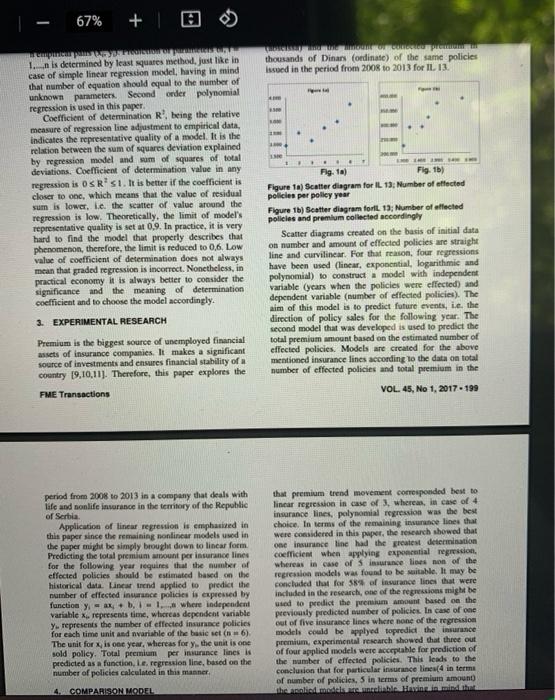
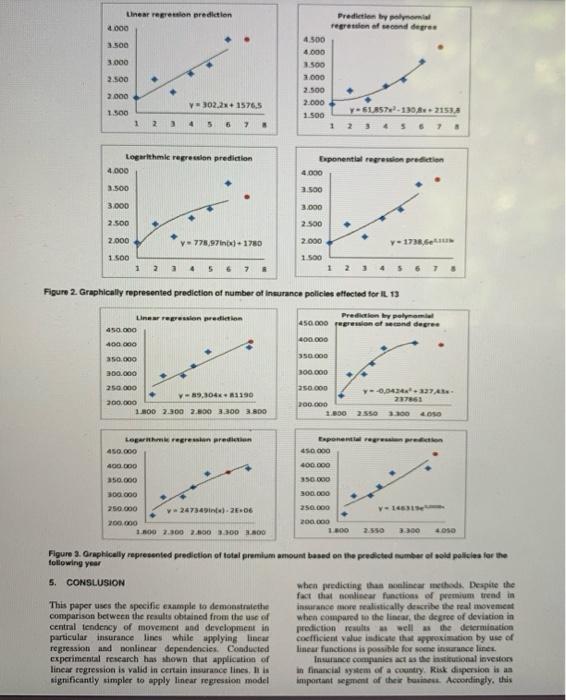
6 67% + T Applying Regression Models to Predict Business Results Jelena Rusov PhD Student Durereado, grade Mirjana Misita Asia Pro University of Bee Faculye Mechanical Engineer Dragan D. Milanovic Full Professor University of Belgrade Faculty of Mechanics Engineering In terms of modern furines practice, business prediction rent are crucially important for evaluation of future financial performance of a company Planning and prediction procedures are especially important for companies operating under certainty. This paper shows on comple of planning and prediction of business results in ince when calculating premium Trend by use of linear and nonlinear regression. Due to the uncertainty associated with the moment of daim occurrence and claim amount it is to secure enough asset to cover the risk Asset liability matching requires the prediction of future premium movement per insurance lines which represents the basic concept of development and operation of insurance companies . Dragan Milanovic A Professor University of Belgrade Faculty of Mechanical Engineering Keywords: linear regression nonlinear models, prediction, number of policies premio 1. INTRODUCTION Definition of business objectives through relation between the value of income, expense and gain is one of the basic goals when predicting the cost-effectiveness of business operations in a specific time frame. Analysis of business predictions aims at determining potentially critical periods that call for additional funds in order to provide the continuing operation of a company This paper deals with predictions and profit pranagement on the example of an insurance company. I fredicts financial results of an insurance company while describing the possible movements of premium amount when applying linear regression and nonlinear models Monitoring and predicting of policy sales flow (premium flow) is very important in order to provide enough funds to cover the risk and expenses and to generale profit Predicting the financial results provides the basic concept of development and characteristics of insurance company's operations. It stabilizes the company operations, provides growth, development and improvement of insurance market and provides full protection of insured interests 2. REGRESION MODELS significant data, where as simple methods include only the most important and basic trends in data, thus predicting the future more accurately It is possible to determine the dependence between variables by their praphic illustration, i.e. by drawing the scatter diagram based on the empirical data. Scatter diagram represents the set of values of two observed numerical variables, ie. it shows the movement of function when its argument takes all the values from the domain of definition. Based on the appearance of initial values in scatter diagram, the character and intensity of interdependence of variables may be determined [6.7.121 The dependence of experimental points cannot always be presented with linear model. As a result, this paper uses different forms of functions to show the development of regression model Linear model and exponential, polynomial and logarithmic nonlinear models are used to predict the number of sold policies as well as the collected premium amount. Applied curviline models can be converted into a model of linear regression by transformation process. Linear regression is the simplest regression model and it turned out to be very significant in modelling of a wide variety of phenomena, primarily in marketing and economic Teiearch. In addition, it is characterized by a prompt projection and low complexity level For lineal model sample regression curve has the form ya, b, provided that for each pair of sample data yil implies that yaxb. The goal of linear regression analysis is to evaluate coefficients and the describe linear dependence in the whole population, based on the initial data (i = 1. anciers of linen trend, and are the variables calculated for each specific case and in this paper, they are evaluated by the least square method: Regression analysis of a phenomenon aims at defining the regularity of a phenomenon development. Based on that regularity, regression analysis enables prediction of the future progress of a phenomenon. Repression model implies the class of stochastic modela represented by an cquation where a dependent variable is expressed as a linear of nonlinear function of independent variables Much research has shown that the complexity of method does not have to be in correlation with data accuracy 5.8.13). Complex methods might get too close to less Received: November 2014. Accepted: June 2015 Dandelen 3 M-3 Parameter b represents the initial trend value, while parameter being the slope of a line, represents the constant variable of incline or decline of trend from one period to the other. In the mentioned example, those parameters are calculated separately for each line of insurance, number of sold policies and amount of collected premium. Applied exponential model is y ace After app lying the logarithm, the linear model in yd x.inc is obtained. Analysis of the transformed model is the same as the analysis of the linear model. Though, it should be pointed out that when interpreting the results, it is important to pay attention to what variables are the transformed ones. In the mentioned model, values of parameters that are estimated with empirical values, are obtained in logarithmic values, since the transformation of dependent variable was performed. After applying antilogarithm, the value of variable of initial model is obtained. The general form of logarithmic regression used for prediction is y-p+ In x which is by transformation of independent variable(t - ln x)) brought down to linear form. Analysis of the transformed part is the same as the analysis of linear model. Nonetheless, special ention should be paid to transformation of independent variable. When choosing the curve that best fits the points in diagram, the starting point may be the polynomial regression model General form of polynomial regression is y- by + bx + ... + bx". Polynomial coefficients are the parameters of regression model that yhould be evaluated. Evaluation is performed with Ja empirical pairs (xy). Prediction of parameters bi, i is determined by least squares method, just like in case of simple linear regression model, having in mind that number of equation should equal to the number of unknown parameters Second order polynomial regression is used in this paper. Coefficient of determination R being the relative measure of regression line adjustment to empirical data, indicates the representative quality of a model. It is the relation between the sum of squares deviation explained by regression model and sum of squares of total deviations. Coefficient of determination value in any regression is OSR's. It is better if the coefficient is closer to one, which means that the value of residual sum is lower, Le. the scatter of value around the regression is low. Theoretically, the limit of models representative quality is set 0,9. In practice, it is very hard to find the model that properly describes the phenomenon, therefore, the limit is reduced to 0.6. Law value of coefficient of determination does not always mean that graded regression is incorrect. Nonetheless, in practical economy it is always better to consider the significance and the meaning of determination coefficient and to choose the model accordingly, 3. EXPERIMENTAL RESEARCH possibility to predict the number of effected policies and premium amount of the insurance lines with the biggest share in one of the insurance companies operating in the Republic of Serbia (OL - Accident Insurance, 02 Voluntary Health Insurance, 03 - Motor Insurance, 07 Goods in Transit Insurance. 08 - Property Insurance against Fire and Allied perils 09 - Other Property Insurance Lines, 10 Motor Vehicle Liability Insurance, 13 - General Liability Insurance, 14 - Credit Insurance, 18 - Travel Assistance Insurance, 20 -Life Insurance and 22 - Supplementary Insurance along with Life Insurance (according to the codes of the National Bank of Serbia)). In order to determine the future flow of collected premium, it is necessary to graphically show the movement of the number of effected insurances and related premiums in the past. Scatter diagrams provide clearer picture of phenomenon movement and indicate the possible type of mathematical model that would describe the movement of observed phenomenon value through the timeframe. In total, 24 scatter diagrams for 12 insurance lines are created. Two graphs correspond to each insurance line. One graph shows the functions of experimental data on number of effected policies per policy yeat, while the other shows the premium amount per effected insurance policies. The entire research will be shown through the example of only one insurance line - General Liability Insurance (insurance line IL 13). The Figure la) shows the scatter diagram of dependency of number of effected policies per policy year, while Figure ib) shows the diagram of dependency of number of effected policies (abscissa) and the amount of collected premium in thousands of Dinars (ordinate) of the same policies issued in the period from 2008 to 2013 for IL 13. 1.400 Fig. 10) Fig. 1b) Figure 1) Scatter diagram for IL 13; Number of effected policies per policy year Figure 1b) Seatter diagram foll 13: Number of elected policies and premium collected accordingly Scatter diagrams created on the basis of initial data on number and amount of effected policies are straight line and curvilinear. For that reason, four regressions have been used (linear, exponential, logarithmic and polynomial to construct model with independent variable years when the policies were effected) and dependent variable (number of effected policies). The aim of this model is to predict future events, ie. the direction of polley sales for the following year. The n C of Serbia Application of linear regression is emphasized in this paper since the remaining nonlinear models used in the paper might be simply brought down to linear form Predicting the total premium amount per insurance lines for the following year requires that the number of effected policies should be estimated based on the historical data. Linear trend applied to predict the number of effected insurance policies is expressed by function y-ax+bil... where independent variable represents time, whereas dependent variable y represents the number of effected insurance policies for each time unit and variable of the basic set (n = 6). The unit for x is one year, whereas for y. the unit is one sold policy. Total premium per insurance lines is predicted as a function, i.e. regression line, based on the number of policies calculated in this manner 4. COMPARISON MODEL The comparison between the number and the amount of policies obtained by linear, logarithmic, exponential and polynomial regression for 12 insurance lines is performed in experimental research. In total, 48 functions were generated to predict the number of policies and the same number of functions was created to predict the amount of collected premium It is determined that linear function best describes the movement of empirical data for prediction of number of policies in case of 3 insurance lines, whereas polynomial approximation was the most efficient in case of 5 out of 12 insurance lines that were considered It should be mentioned that determination coefficients of linear and polynomial regressions have approximately the same values in case of 3 out of 5 insurance lines. Therefore, it might be concluded that for 50% of total number of insurance lines considered in the research, lineartrend turned out to be the best option for predicting the number of policies soldin the following year. Regarding 4 insurance lines, this experiment showed that linear regression and nonlinear models were unreliable for predicting the number of policies sold (maximum determination coefficient was R 50,31). Therefore, in case of 67% of cumined insurance lines, least one of the regression models might be valid to predict the number of policies. If there are many regression models whose trends of movement are good at adjusting to the schedule and movement of initial data (which is the case for insurance lines), the prediction model should be chosen carefully. While applying various regression types to predict aber and amount of policies, it should be emphasized that the quality of human prediction might be crucial in method selection in view of the fact that sometimes quantitative methods do not provide better estimates than people. The assessment of a manager is significant provided that it is not the single but one of the prediction methods Further research deals with central tendency of movement and development of premium mount based on the predicted number of policies. Analysis showed insurance lines, polynomial regression was the best choice. In terms of the remaining insurance lines that were considered in this paper, the research showed that one insurance line had the greatest determination coefficient when applying exponential regression, whereas in case of 5 insurance lines son of the regression models was found to be suitable. It may be concluded that for 58% of insurance lines that were included in the research, one of the regressions might be used to predict the premium amount based on the previously predicted number of policies. In case of one out of five insurance lines where none of the regression models could be applyed topredict the insurance premium, cxperimental research showed that three out of four applied models were acceptable for prediction of the number of effected policies. This leads to the conclusion that for particular insurance lines(4 in terms of number of policies, in terms of premium amount the applied models are unreliable. Having in mind that applied regressions do not correspond to the movement of empirical data, future research may be directed toward the formation of analytical functions. Their movement trend is adjusted to the schedule and movement of original data in the best possible manner and that can be used to show the future sales development for those insurance lines separately. The comparison betweenthe results obtained by application of linear regression and nonlinear functions, showed the deviation of 50%. This deviation indicates that the use of linear regression concept is valid when predicting business results in particular insurance lines. This paper compares the methods through the example of General Liability Insurance. Figure 2 shows the number of sold policies predicted by the aforementioned regressions. The highest determination coefficient of predicted number of effected policies is obtained in polynomial regression (R = 0.90), while the lowest is obtained through logarithmic regression (R = 0.69 which is in practice considered to be the representative model). Linear regression model shows that 839 of change in dependent variable is explained by the change in independent variable Based on the data projected in this mannerand used to predict the number of sold policies, it is possible to predict the amount of collected premium, Figure). In case of number of policies, as well as in case of premium amount, the best approximation is obtained by polynomial function of second degree (R' 0.92), whereas the worst (where determination coefficientis 0,8I) is obtained by logarithmic function. Relative measure of linear model, where the evaluated regression is adjusted to the value of samples amounts to 0.86. When the deviations of many different trend functions based on the empirical data (in the stated example, the difference in coefficient determination for polynomial and linear regression for number of policies soldis 0,07, while for the premium amount it is 0,06) are small, the choice of method is achieved by experience and assessment of the human factor. In the Figures 2 and 3. empirical data are represented by rhomb, whereas predictions (number of policies and premium amount) are represented by circle 67% + thousands of Dinars (ordinate) of the same policies Issued in the period from 2008 to 2013 for IL 13. con 1. n is determined by least squares method, just like in case of simple linear regression model, having in mind that number of equation should equal to the number of unknown parameters. Second order polynomial regression is used in this paper Coefficient of determination R', being the relative measure of regression line adjustment to empirical data, indicates the representative quality of a model. It is the relation between the sum of squares deviation explained by regression model and sum of squares of total deviations. Coefficient of determination value in any regression is OSR's. It is better if the coefficient is closer to onc, which means that the value of residual sum is lower. ic. the scatter of value around the regression is low. Theoretically, the limit of model's representative quality is set at 0,9. In practice, it is very hard to find the model that properly describes that phenomenon, therefore, the limit is reduced to 0,6. LOW value of coefficient of determination does not always mean that graded regression is incorrect. Nonetheless, in practical economy it is always better to consider the significance and the meaning of determination coefficient and to choose the model accordingly. 3. EXPERIMENTAL RESEARCH Fig. 1) Fig. 15) Figure 1) Scatter diagram for IL 13: Number of effected policies per policy year Figure 1b) Scatter diagram forte 13; Number of affected policies and premium collected accordingly Scatter diagrams created on the basis of initial data on number and amount of effected policies are straight line and curvilinear. For that reason, four regressions have been used (linear, exponential, logarithmic and polynomial) to construct a model with independent variable (years when the policies were cffected) and dependent variable (number of effected policies). The aim of this model is to predict future events, ie the direction of policy sales for the following year. The second model that was developed is used to predict the total premium amount based on the estimated number of effected policies. Models are created for the above mentioned insurance lines according to the data on total number of effected policies and total premium in the Premium is the biggest source of unemployed financial assets of insurance companies. It makes a significant source of investments and ensures financial stability of country 19,10,11). Therefore, this paper explores the FME Transactions VOL. 45, No 1, 2017 - 199 period from 2008 to 2013 in a company that deals with life and nonlife insurance in the territory of the Republic of Serbia Application of linear regression is emphasized in this paper since the remaining nonlinear models used in the paper might be simply brought down to linear form. Predicting the total premium wount per insurance lines for the following year requires that the number of effected policies should be estimated based on the historical data. Linear trend applied to predict the nutnber of effected inwurance policies is expressed by function - b -1, where independent variable represents time, whereas dependent variable y represents the number of effected insurance policies for each time unit and varishle of the basic set (6) The unit for is one year, whereas for y, the unit is one sold policy. Total premium per iniurce lines i predicted as a function, le regression line, based on the number of policies calculated in this manner 4 COMPARISON MODEL that premium trend movement corresponded best to linear regression in case of 3, whereas in case of 4 insurance lines, polynomial regression was the best choice. In terms of the remaining insurance lines that were considered in this paper, the research showed that one insurance line had the greatest determination coefficient when applying exponential regression, whereas in case of in die son of the regression models was found to be suitable. It may be concluded that for 58% of insurance lines that were included in the research, one of the regressions might be sed to predict the premium amount based on the previously predicted number of policies. In case of one out of five insurance lines where none of the regression models could be applyed topredict the insurance premium, experimental research showed that three out of four applied models were acceptable for prediction of the number of effected policies. This leads to the conclusion that for particular insurance lines in terme of number of policies. 5 in terms of premium amount the lidmedel Hawidth Linear regression prediction 4000 3.500 3.000 Prediction by mi regression of second degree 4.500 4.000 3.500 1.000 2.500 2.000 1.500 Y-ELS 130821533 1 2.500 2.000 302.2 + 1576.5 1.500 1 2 3 4 557 3 Logarithmie regression prediction 4.000 toponential regression prediction 4.000 3.500 2.500 3.000 3.000 2.500 2.500 2.000 y-778.97in) 1780 2.000 y-1730.. 1.500 1.500 1 2 1 5 6 7 Figure 2. Graphically represented prediction of number of insurance policies affected for IL 13 Linear regression pedition 450.000 Prediction by polyam 450.000 person of degree 400.000 40000 350.000 300.000 350.000 300.000 250.000 V-9,304.1190 200.000 1.100 2.300 2.500 3300 3.800 250.000 Y-0.0443274 200.000 237863 1.100 250 300 40 Exponentegre prin 450 000 400.000 350.000 Logarith regression prediction 450.000 400.000 350.000 300.000 250.000 247349) 206 200,000 1.000 2.300 2.000 300.00 300.000 V14 250.000 200.000 1200 2.550 3.300 400 Figure 3. Graphically represented prediction of total premium amount based on the predicted umber of sold policies for the following year 5. CONSLUSION when predicting this lincar methods. Despite the fact that onlinear functions of premium trend in This paper uses the specific example to demonstratethe insurance more realistically describe the real movement comparison between the results obtained from the use of when compared to the linear, the degree of deviation in central tendency of movement and development in prediction results well as the determination particular insurance lines while applying linca coefficient value indicate that approximation by use of regression and nonlinear dependencies Conducted linear functions is possible for some insurance lines experimental research has shown that application of Insurance companies act as the institutional investors linear regression is valid in certain insurance lines. It is in financial system of a country, Risk dispersion is an significantly simpler to apply linear regression model important segment of the business. Accordingly, this