

Answered step by step
Verified Expert Solution
Question
1 Approved Answer
JUST THE CONCLUSION AND QUESTION PARTS ( Ac Circuits Lab) EXPERIMENT . AC CIRCUITS 80 2. Measure the voltage across the resistor, the capacitor and
JUST THE CONCLUSION AND QUESTION PARTS ( Ac Circuits Lab)
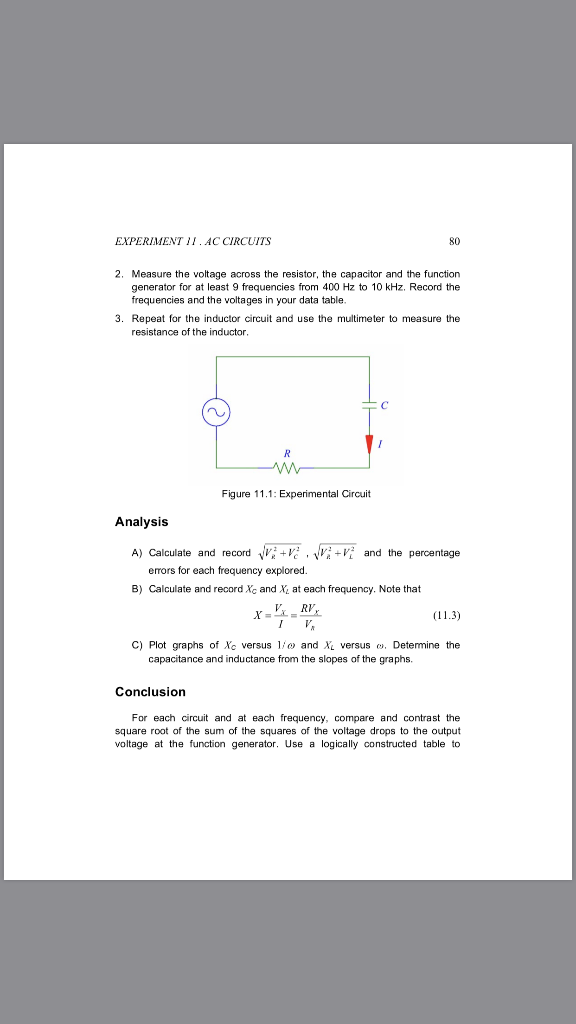
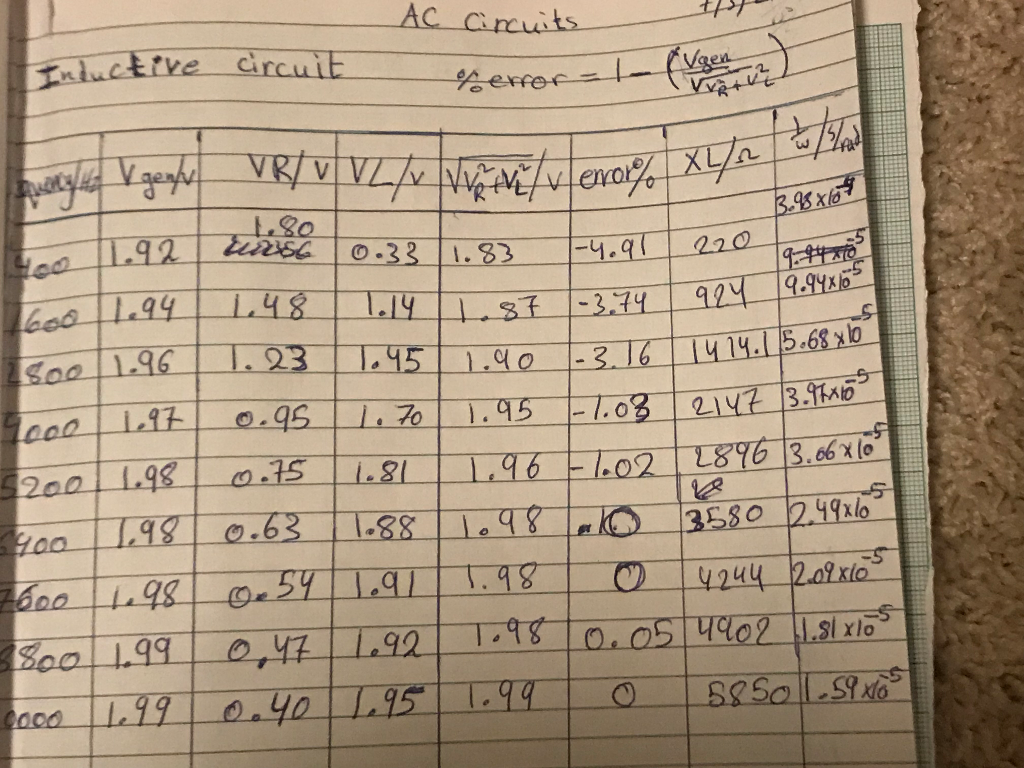
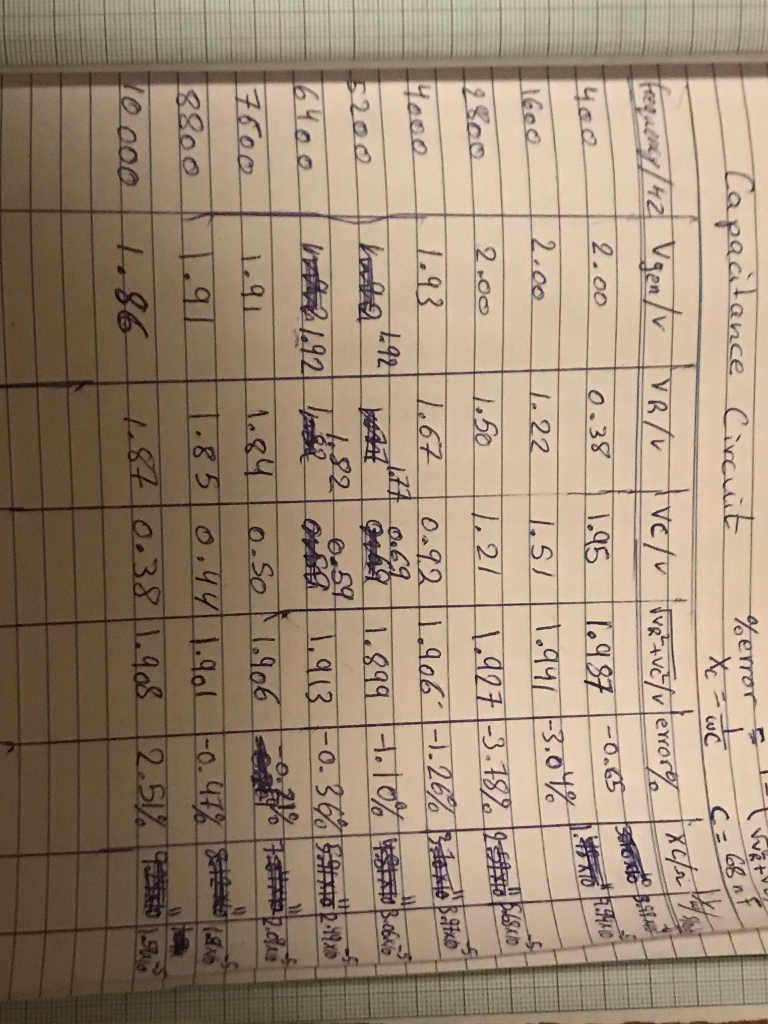
EXPERIMENT . AC CIRCUITS 80 2. Measure the voltage across the resistor, the capacitor and the function generator for at least 9 frequencies from 400 Hz to 10 kHz, Record the frequencies and the voltages in your data table. 3. Repeat for the inductor circuit and use the multimeter to measure the resistance of the inductor Figure 11.1: Experimental Circuit Analysis A) Calculate and record , ..and the percentage errors for each frequency explored. B) Calculate and record Xc and X at each frequency. Note that C) Plot graphs of Xc versus l' and Xe versus o, Determine the capacitance and inductance from the slopes of the graphs. Conclusion For each ccit and at each frequency, compare and contrast the square root of the sum of the squares of the voltage drops to the output voltage at the function generator. Use a logically constructed table to EXPERIMENTI. ACCIRCUITS 81 facilitate this comparison. Discuss your findings. What does the result indicate about voltages in inductive and capacitive A.C, circuits? Compare your experimentally detemined capacitance and inductance to the given values for them. Account for any significant differences. What is the stated tolerances for the circuit elements? What is the significance of the inductor resistance? Question You will see tha the percentage error calculated for the measured total voltage compared to the phasor calculation is much greater for the inductor circuit. What is the source of this error? Your explanation must also explain the frequency dependence of this error. There is a specific logical explanation for this. Do NOT say tht it is a reading error! .ucc 3 3.66 x lo .88 cg acance .93 167 092 1.6 th 1.92 |Do 7 EXPERIMENT . AC CIRCUITS 80 2. Measure the voltage across the resistor, the capacitor and the function generator for at least 9 frequencies from 400 Hz to 10 kHz, Record the frequencies and the voltages in your data table. 3. Repeat for the inductor circuit and use the multimeter to measure the resistance of the inductor Figure 11.1: Experimental Circuit Analysis A) Calculate and record , ..and the percentage errors for each frequency explored. B) Calculate and record Xc and X at each frequency. Note that C) Plot graphs of Xc versus l' and Xe versus o, Determine the capacitance and inductance from the slopes of the graphs. Conclusion For each ccit and at each frequency, compare and contrast the square root of the sum of the squares of the voltage drops to the output voltage at the function generator. Use a logically constructed table to EXPERIMENTI. ACCIRCUITS 81 facilitate this comparison. Discuss your findings. What does the result indicate about voltages in inductive and capacitive A.C, circuits? Compare your experimentally detemined capacitance and inductance to the given values for them. Account for any significant differences. What is the stated tolerances for the circuit elements? What is the significance of the inductor resistance? Question You will see tha the percentage error calculated for the measured total voltage compared to the phasor calculation is much greater for the inductor circuit. What is the source of this error? Your explanation must also explain the frequency dependence of this error. There is a specific logical explanation for this. Do NOT say tht it is a reading error! .ucc 3 3.66 x lo .88 cg acance .93 167 092 1.6 th 1.92 |Do 7Step by Step Solution
There are 3 Steps involved in it
Step: 1

Get Instant Access to Expert-Tailored Solutions
See step-by-step solutions with expert insights and AI powered tools for academic success
Step: 2

Step: 3
Ace Your Homework with AI
Get the answers you need in no time with our AI-driven, step-by-step assistance
Get Started
The Payroll Audit
Authors: Robert Leach
1st Edition
0955970792, 978-0955970795