

Answered step by step
Verified Expert Solution
Question
1 Approved Answer
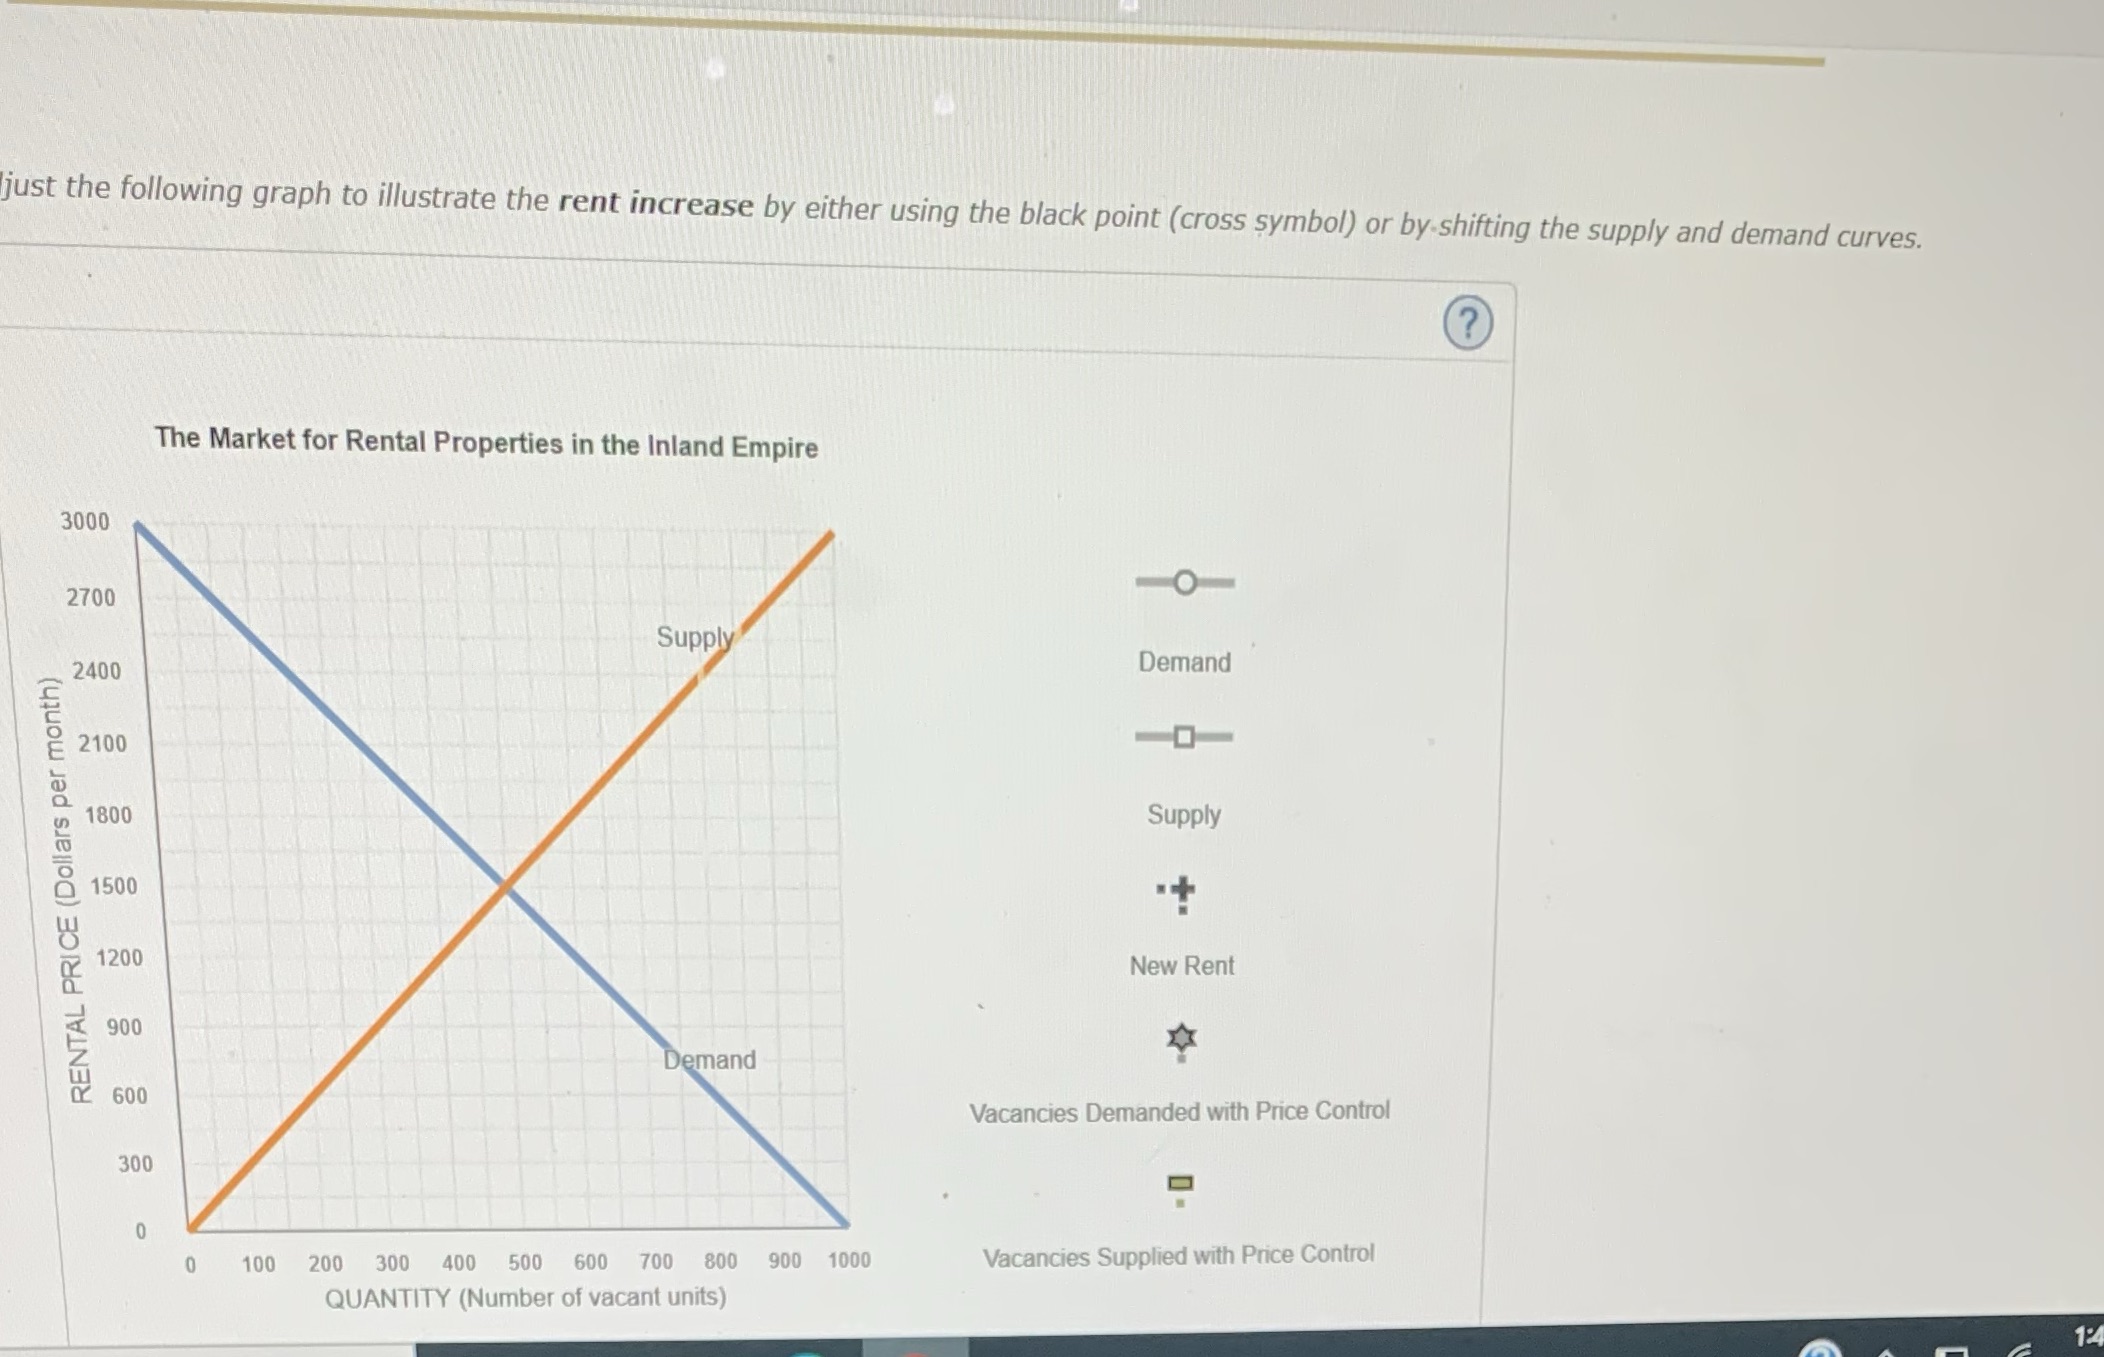
just the following graph to illustrate the rent increase by either using the black point (cross symbol) or by-shifting the supply and demand curves. The
Step by Step Solution
There are 3 Steps involved in it
Step: 1

Get Instant Access to Expert-Tailored Solutions
See step-by-step solutions with expert insights and AI powered tools for academic success
Step: 2

Step: 3
Ace Your Homework with AI
Get the answers you need in no time with our AI-driven, step-by-step assistance
Get Started
Price theory and applications
Authors: Steven E landsburg
8th edition
538746459, 1133008321, 780538746458, 9781133008323, 978-0538746458